
This article explores how you can leverage Chrome Recorder, Puppeteer, and Lighthouse Audit to streamline and enhance the testing process for Oracle APEX applications. By combining these tools, developers can automate testing tasks, identify potential issues and optimize application performance.
I will look at recording automated flow through the application without any coding – just by using the Recorder built into the Google Chrome browser. I will also show you how to test your application with Lighthouse Audit and explore metrics like performance, accessibility or best practices. All within the user flow I’ll define at the start.
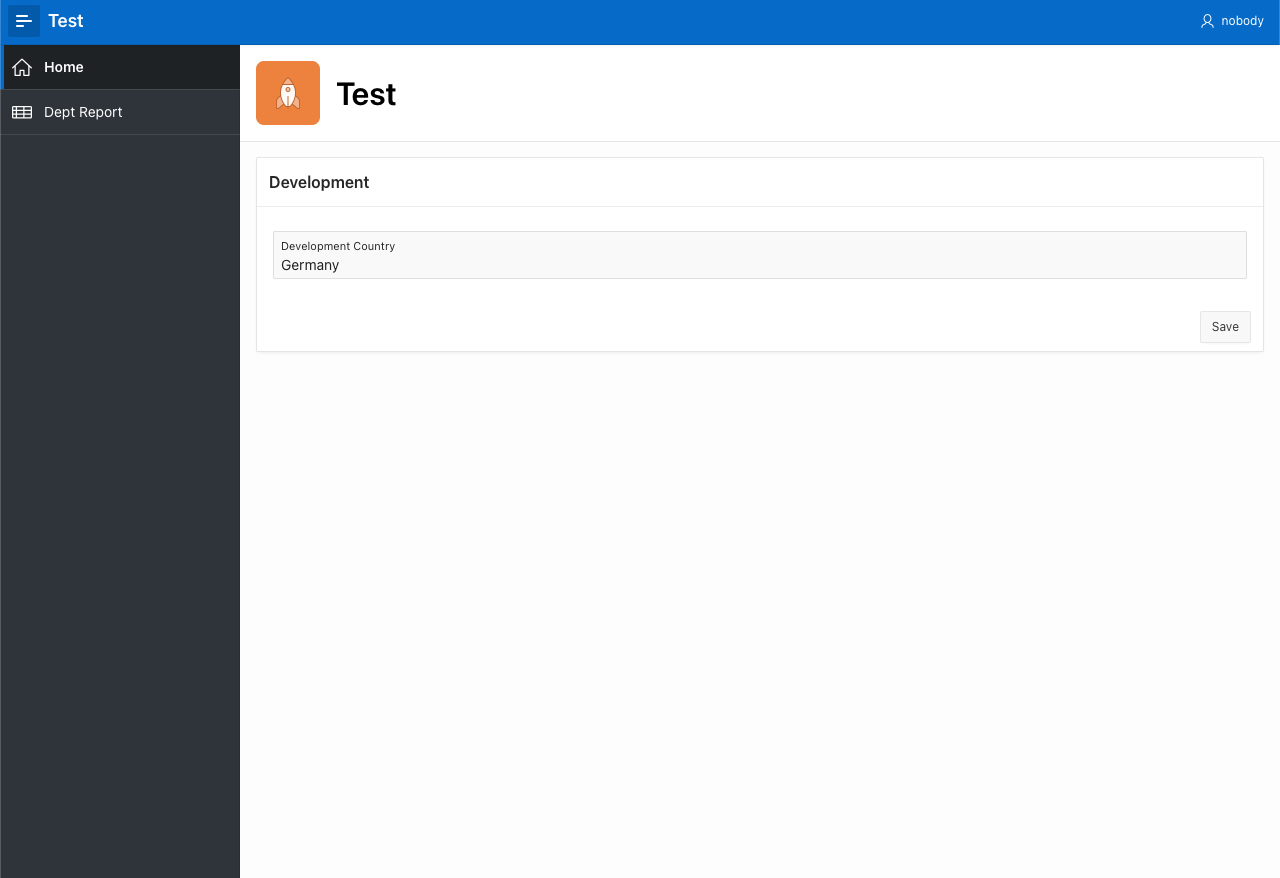
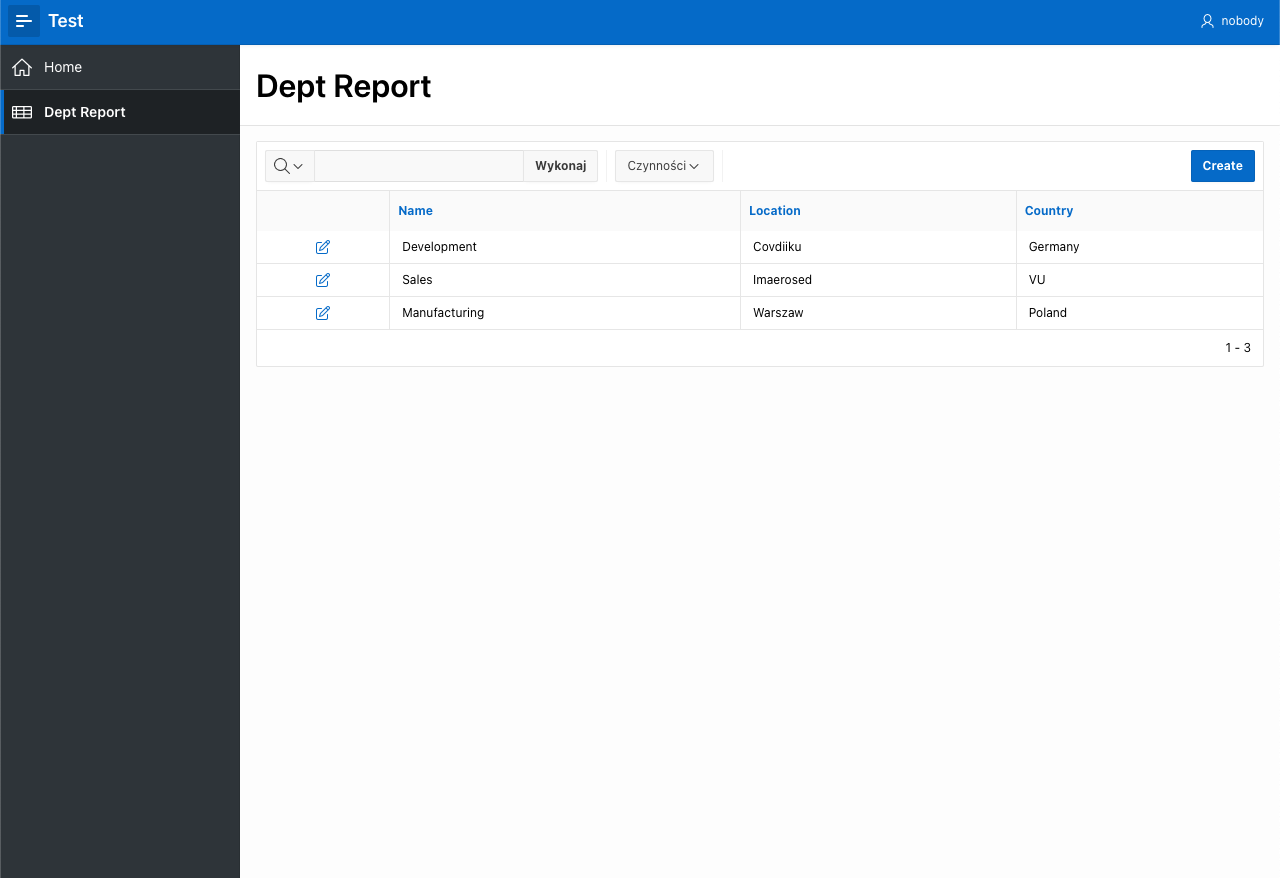
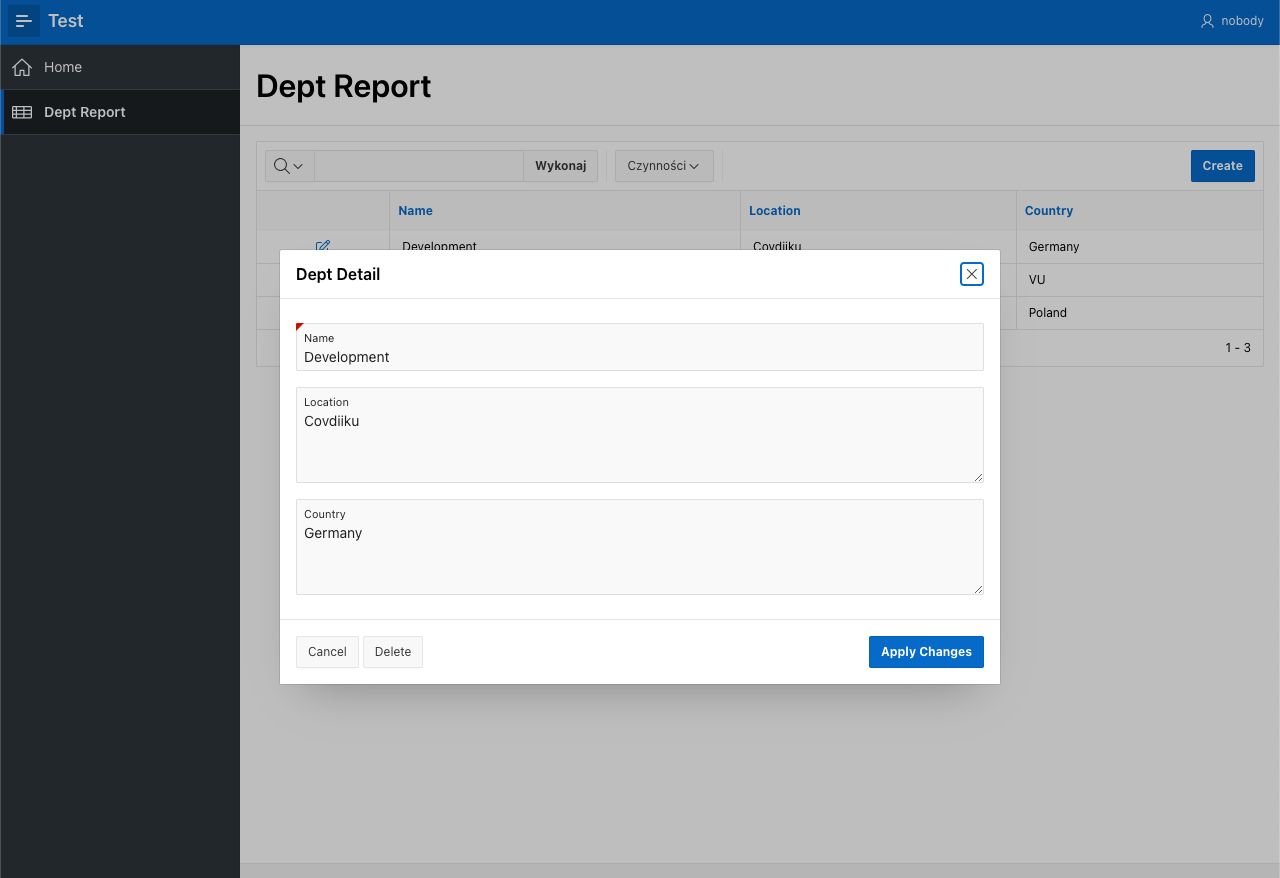
First, let’s look at the APEX application I will test. It is a simple app with three pages.
I’ll record the user workflow so I can use it for automated tests later. I will use Chrome Recorder, which is available in the Google Chrome browser from version 97 and above. If you want to know more about Recorder, please take a look at the documentation.
My user flow will look like this:
To ensure that my headless browser, which I use later for the automated test, will have enough time to open and close windows, I will employ a few Wait for element steps.
The recording process is very simple – this video shows you precisely how to make a recording of the workflow specified above.
As you can see, I can replay the user flow, which repeats exactly what I recorded. I also don’t have to do it in the browser – I can export our flow and run it programmatically 🙂
To export the recording, I will simply click on the export icon in the Recorder.
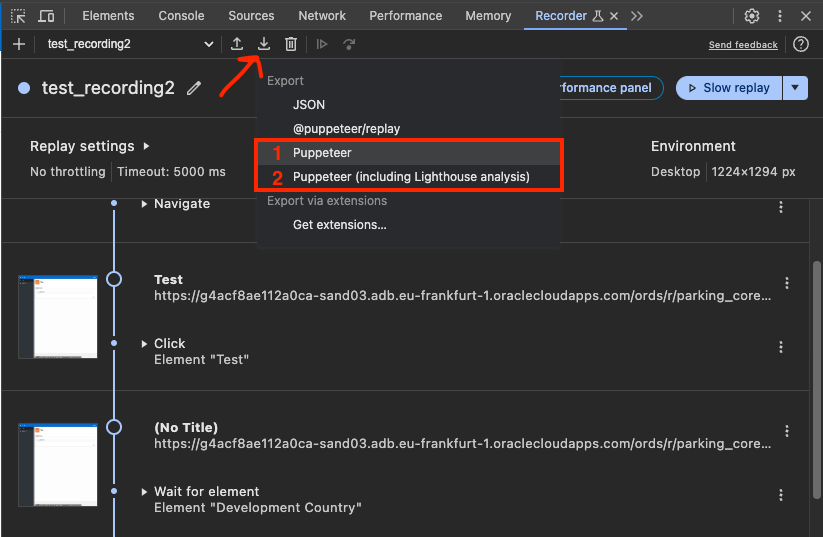
I will export it in two versions: Puppeteer and Puppeteer (including Lighthouse analysis). Here are the tools I use for this:
Let’s start with the Puppeteer version. To run the script, I need to install a Node.js and Puppeteer package. If you’re unsure how to do this, you can refer to this tutorial.
When I have everything installed, I can simply run my test recording in the terminal.
tomaskucharzyk@Tomass-Air-2 puppeteer-test % node test_recording2.js
tomaskucharzyk@Tomass-Air-2 puppeteer-test %
It runs for a few seconds. If everything goes well, there will be no errors, and the script will finish.
I go to the application, hide the Development Country page item on the Home page and run the script again.
tomaskucharzyk@Tomass-Air-2 puppeteer-test % node test_recording2.js
Error: Timed out
    at waitForFunction (/Users/tomaskucharzyk/puppeteer-test/test_recording2.js:569:13)
    at async waitForElement (/Users/tomaskucharzyk/puppeteer-test/test_recording2.js:457:7)
    at async /Users/tomaskucharzyk/puppeteer-test/test_recording2.js:50:9
tomaskucharzyk@Tomass-Air-2 puppeteer-test %
I have an error on line 50. When I examine my test_recording.js script, I see that on this line, I have a waitForElement step that checks if there is a Development Country element with the value Germany.
{
        const targetPage = page;
        await waitForElement({
            type: 'waitForElement',
            target: 'main',
            selectors: [
                'aria/Development Country',
                '#P1_DEVELOPMENT',
                'xpath///*[@id="P1_DEVELOPMENT"]',
                'pierce/#P1_DEVELOPMENT',
                'text/Germany'
            ],
            attributes: {
                value: 'Germany'
            }
        }, targetPage, timeout);
  }
It works. You can modify the script or the handling of the script to give you a better error message – using, for example, Chai.js and Mocha.js – but for now, I will simply add console.log to see what is going on. To speed things up, I asked GitHub Copilot to do it for me – it simply added console logs like below.
console.log(`\x1b[32m✔ Navigating to URL \x1b[0m`);
...
  actual step code
...
console.log(`\x1b[32m✔ Navigating to URL completed\x1b[0m`);
If you want to examine the file changes, you can find both files here.
Now, when I run the script in the terminal, I see logs of the steps in the console as visualized in the image below.
That was a fast test! It’s pretty efficient, but don’t forget to set the Wait for element steps. Otherwise, it may not wait for modal windows to close and cause unexpected errors.
This is what the logs look like:
tomaskucharzyk@Tomass-Air-2 puppeteer-test % node test_recording2_console_log.js
 Navigating to URL
✔ Navigating to URL completed

 Click on the Application Logo
✔ Click on the Application Logo completed

 Waiting for P1_DEVELOPMENT value Germany
✔ Waiting for P1_DEVELOPMENT value Germany completed

 Click on the Development Country field
✔ Click on the Development Country field completed

 Changing value to Poland
✔ Changing value to Poland completed

 Click on the Save button
✔ Click on the Save button completed

 Navigate to Dept Report
✔ Navigate to Dept Report completed

 Waiting for Dept Report
✔ Waiting for Dept Report completed

 Click on the Row Edit link
✔ Click on the Row Edit link completed

 Waiting for Dept Detail
✔ Waiting for Dept Detail completed

 Click on the Country field
✔ Click on the Country field completed

 Change the Country field to Germany
✔ Change the Country field to Germany completed

 Click on the Apply Changes button
✔ Click on the Apply Changes button completed

 Waiting for Dept Report
✔ Waiting for Dept Report completed

 Waiting for Home navigation link
✔ Waiting for Home navigation link completed

 Click on the Home navigation link
✔ Click on the Home navigation link completed

 Waiting for P1_DEVELOPMENT value Germany
✔ Waiting for P1_DEVELOPMENT value Germany completed

tomaskucharzyk@Tomass-Air-2 puppeteer-test %
Now, let’s look at the Puppeteer (including Lighthouse analysis) file that I exported. You can use Lighthouse on a single page in your browser – there is a Lighthouse tab in Google Chrome developer tools.
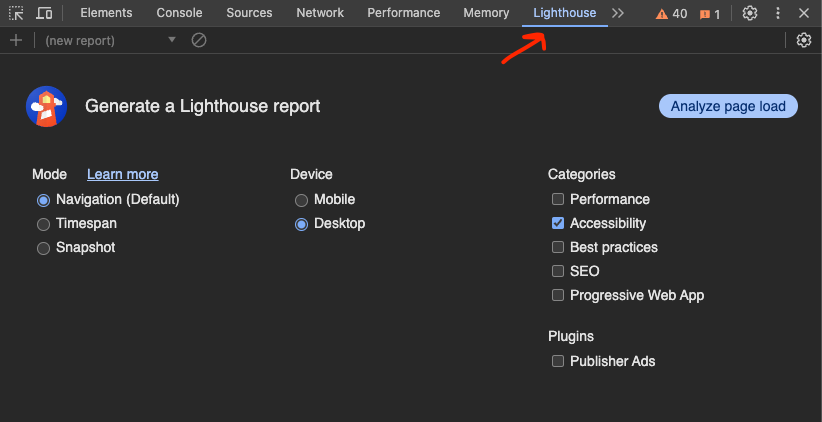
When I open the Lighthouse tab, I can set the categories I want to test and click the Analyze the page load button. It will generate HTML reports with all the metrics. The example below is the Lighthouse analysis of the apex.oracle.com website.
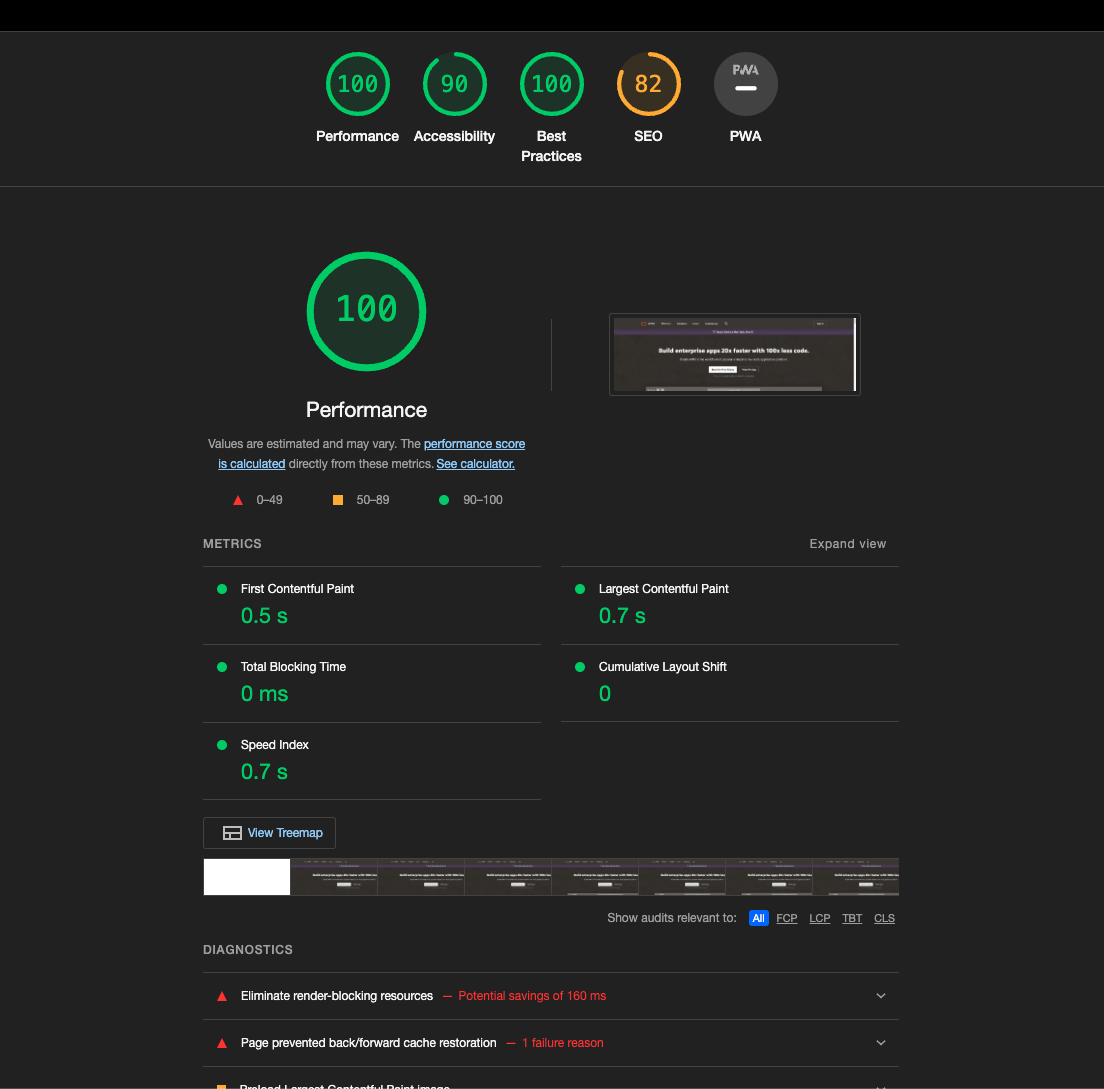
This may be useful if you want to test the performance of your application or when you have to meet accessibility requirements like WCAG, for example.
Because I recorded my user flow in the application, I can test all the pages and user interactions simultaneously with one command.
To do this, I’ll need to install Lighthouse in Node.js. You can find the details on how to do it in the documentation, but – long story short – you will probably just need the command below.
npm install lighthouse

---It will look like that when you run the command

tomaskucharzyk@Tomass-Air-2 puppeteer-test % npm install lighthouse

added 67 packages, and audited 249 packages in 5s

32 packages are looking for funding
  run `npm fund` for details

found 0 vulnerabilities
tomaskucharzyk@Tomass-Air-2 puppeteer-test %
When Lighthouse is ready, I can just run the test script in the terminal.
tomaskucharzyk@Tomass-Air-2 puppeteer-test % node test_recording2_lighthouse.js
tomaskucharzyk@Tomass-Air-2 puppeteer-test %
This may take some time, depending on the size of your flow. In this case, it took about 20 seconds to finish the audit.
Running the script in Node.js generates a file with the default name flow.report.html. When I open it, it shows an audit of all my pages and interactions, like the picture below. If you want to examine the full report, you will find it here.
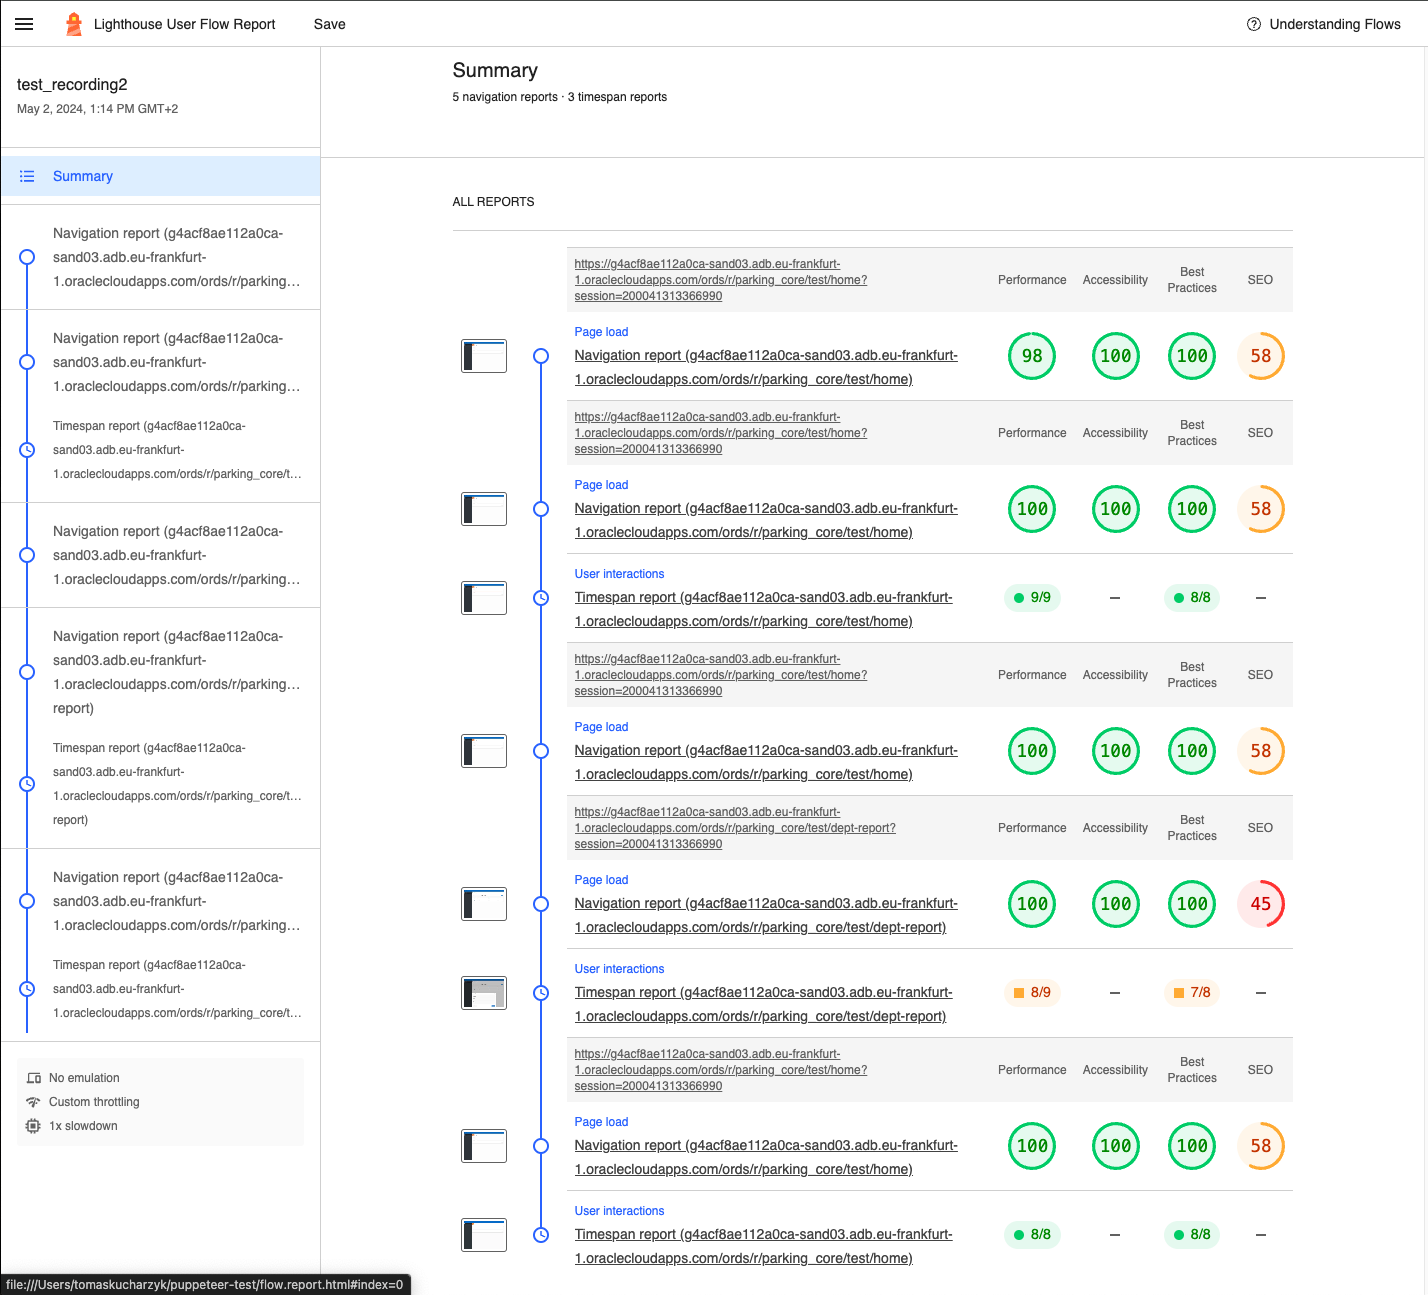
You can see all the metrics when you click on one step in the flow. There is a lot to explore, so please try it out yourself.
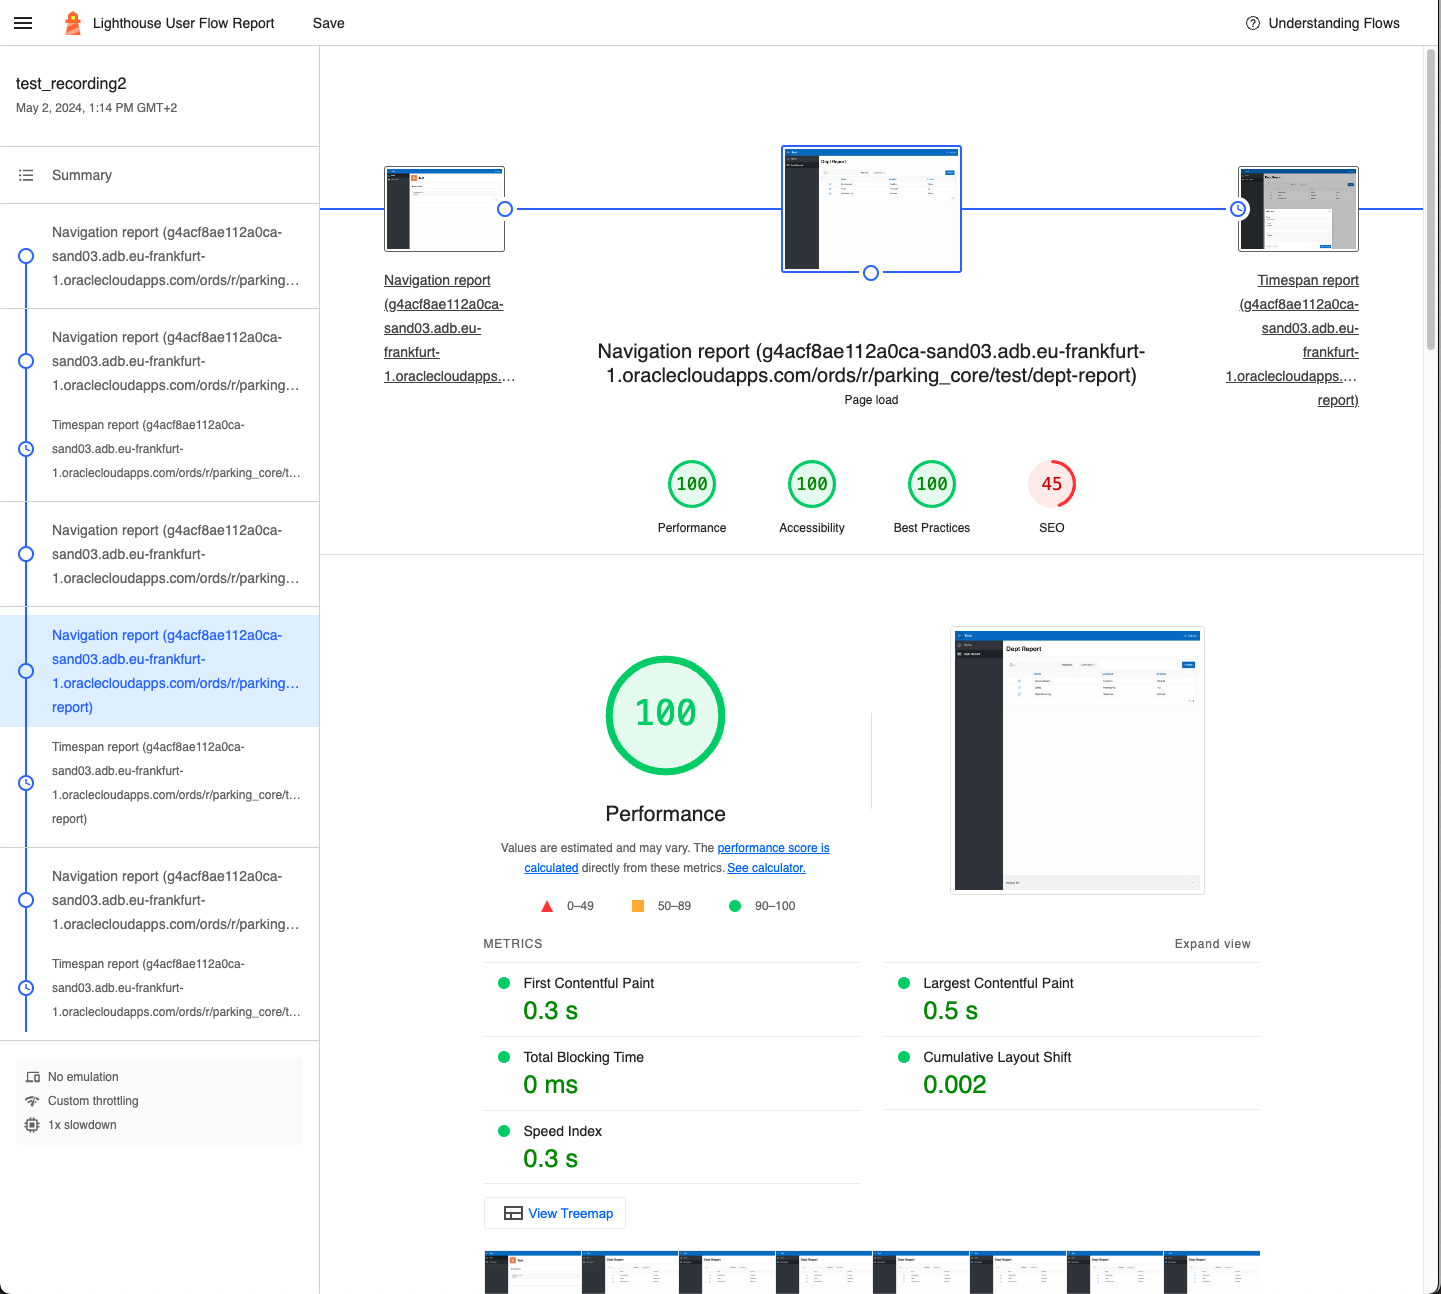
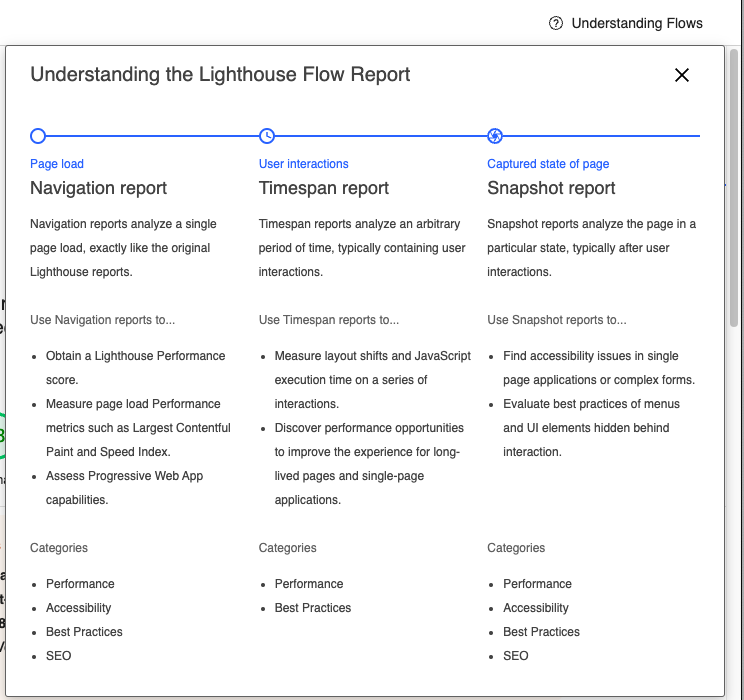
Click the Understanding Flows button in the top right of the report if you need more information – or simply refer to the documentation.
As you can see, integrating Chrome Recorder, Puppeteer, and Lighthouse Audit into your Oracle APEX testing strategy can greatly improve the quality, performance, and accessibility of your applications. This article has demonstrated how to use these tools to create basic automated tests, elevate your testing process and ensure a seamless user experience for your APEX applications. Try these tests out for yourself, and experiment. If you have any questions, reach out to me at tkucharzyk@pretius.com.
Also, if you’re interested in Oracle APEX, be sure to check out some of the other articles on our blog:
Do you need help with low-code app development? Pretius has extensive experience with Oracle APEX and other low-code platforms (we have many well-known international speakers and several Oracle ACEs on our team). We’ll be happy to help you! Drop us a line at hello@pretius.com or use the contact form below. We’ll get back to you within 48 hours.


