
Someone approached me at a conference and explained that their application was experiencing performance problems. They asked if I had any tips for understanding what was happening. My go-to answer was to get that application in debug mode – work out what’s happening and resolve it from there.
Safely back home, I was mulling over the question and potential answers, and I decided to research further. It didn’t take long before I found Michelle’s blog article on 15 Top Tips to Tune Your Oracle APEX Performance. It’s awesome! 🤩 A first-class read – well-written, with very helpful tips.
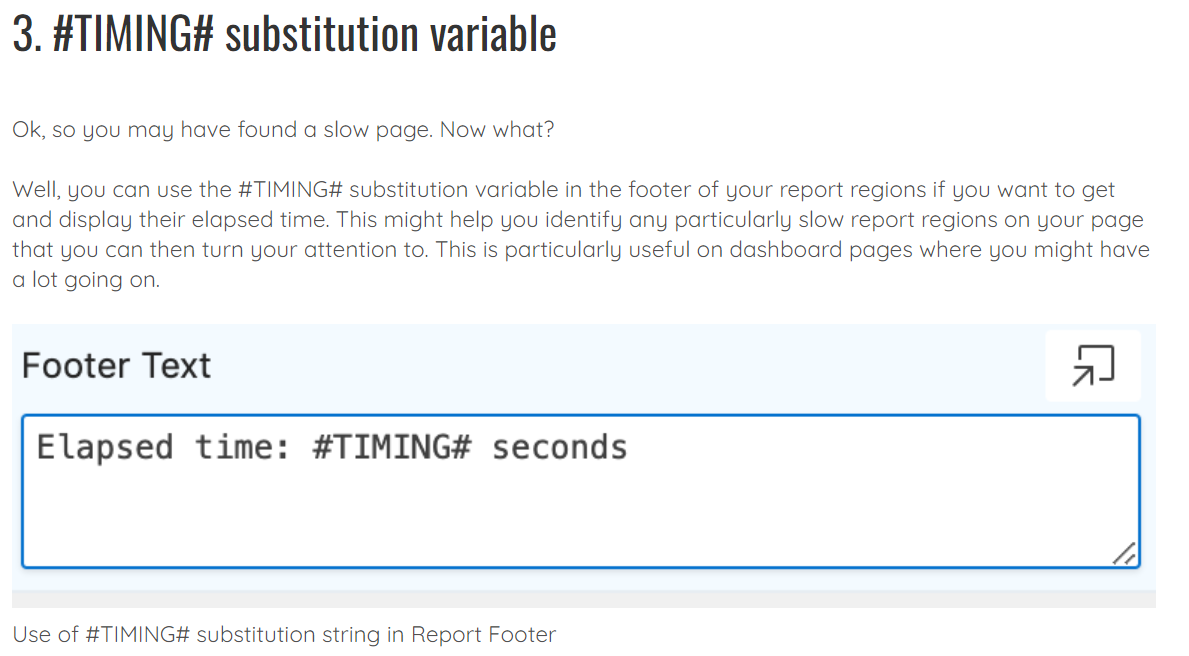
Michelle’s tip number 3 – the #TIMING# substitution variable – piqued my interest during the lecture, so I decided to take a closer look.
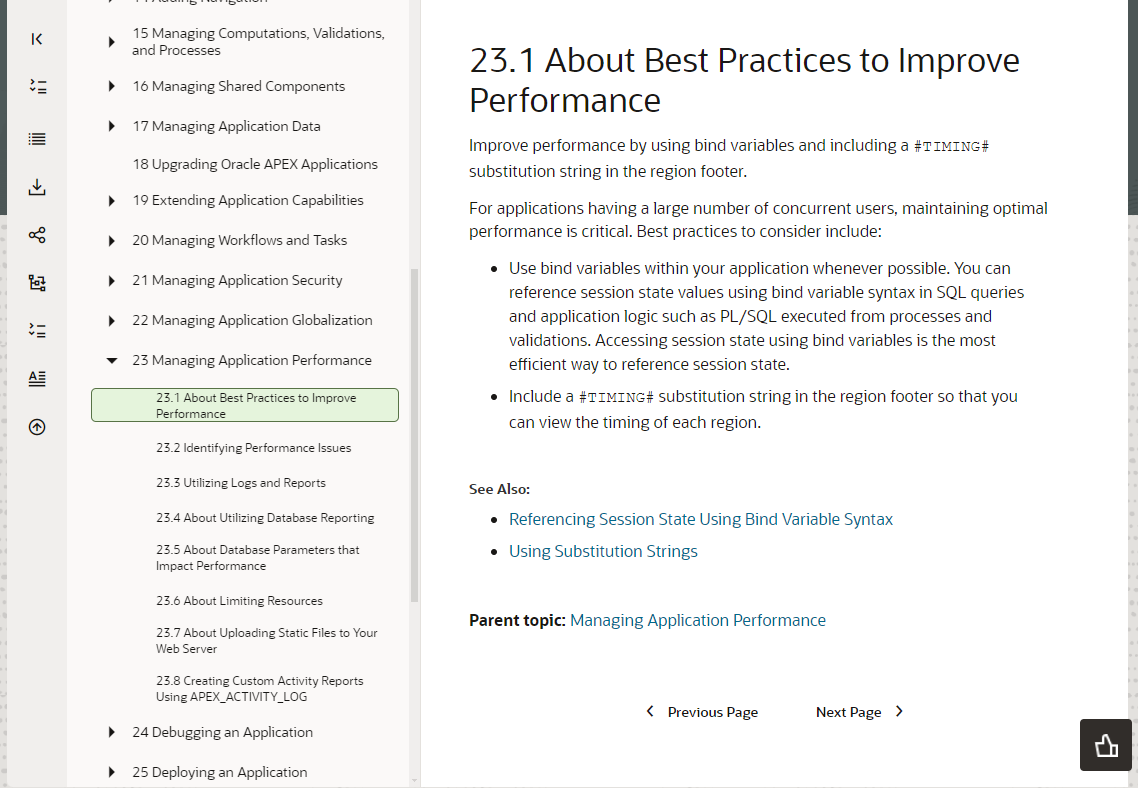
After all, #TIMING# also appears as one of only two tips on the Best Practices to Improve Performance page of the official APEX documentation. Did you know this?
To quote:
Improve performance by using bind variables and including a #TIMING# substitution string in the region footer.
I’m interpreting this as “you can improve performance by using bind variables or/and including a #TIMING# substitution string in the region footer”.
I’m really not sure how adding a string in the region footer will speed anything up. If it actually did, then wouldn’t it be applied to all regions by default? However, for now, let’s assume that the #TIMING# substitution string has some magical performance enhancement powers (spoiler: it doesn’t).
But what is a substitution string? The documentation (section 3.10.4) lists all the Substitution Strings:
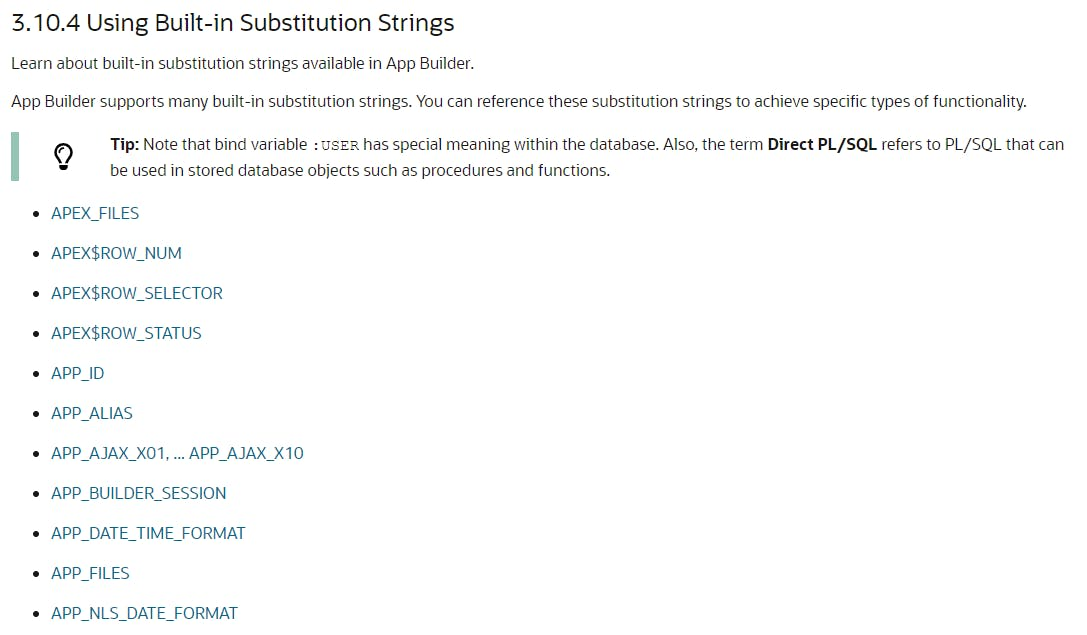
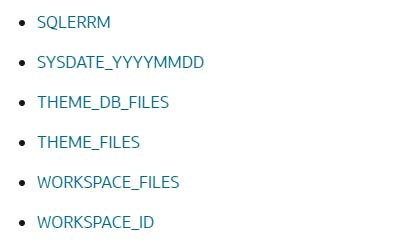
However, if we scroll down to where TIMING should be (things are roughly in alphabetical order, but not 100%) it’s absent.
So is it a substitution string, or is it not?
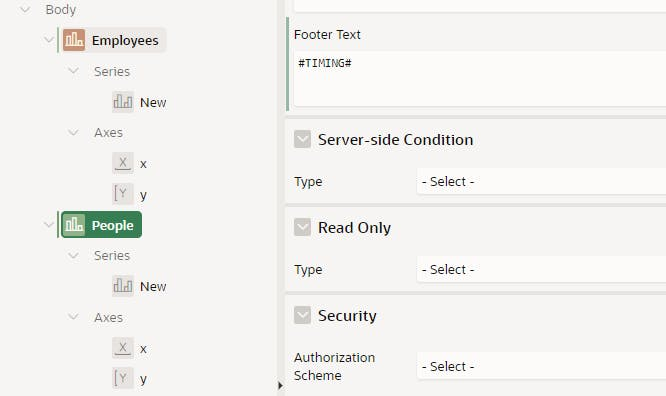
Let’s try it out anyway. I have a couple of charts on a page, so I add #TIMING# to the Footer Text of each region one by one (because it’s not possible to bulk select multiple regions and change all the Footer Texts at once).
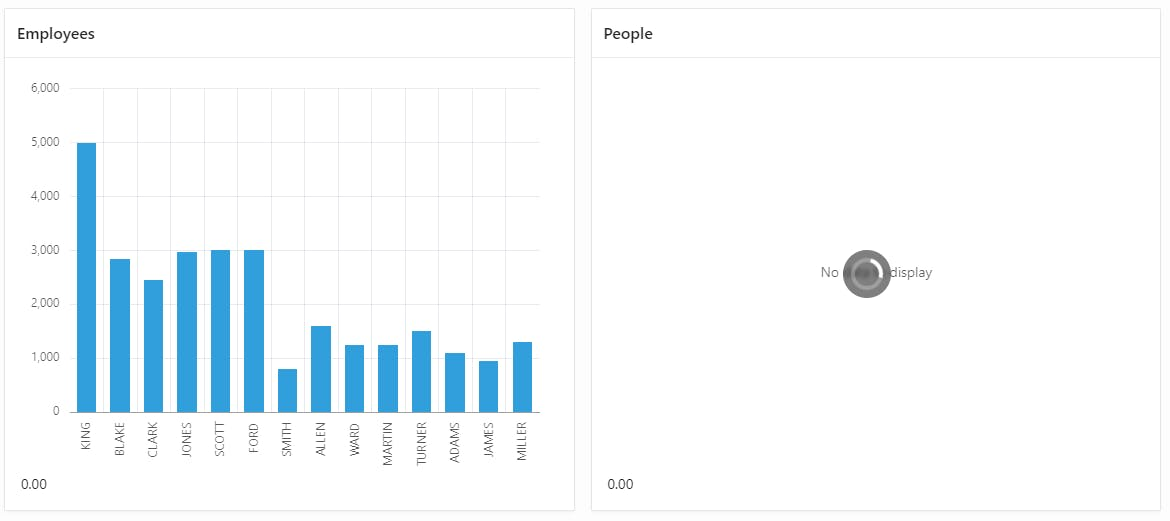
There we go – let’s run the app. It contains two identical charts with the same SQL: one is called Employees, the other is called People.
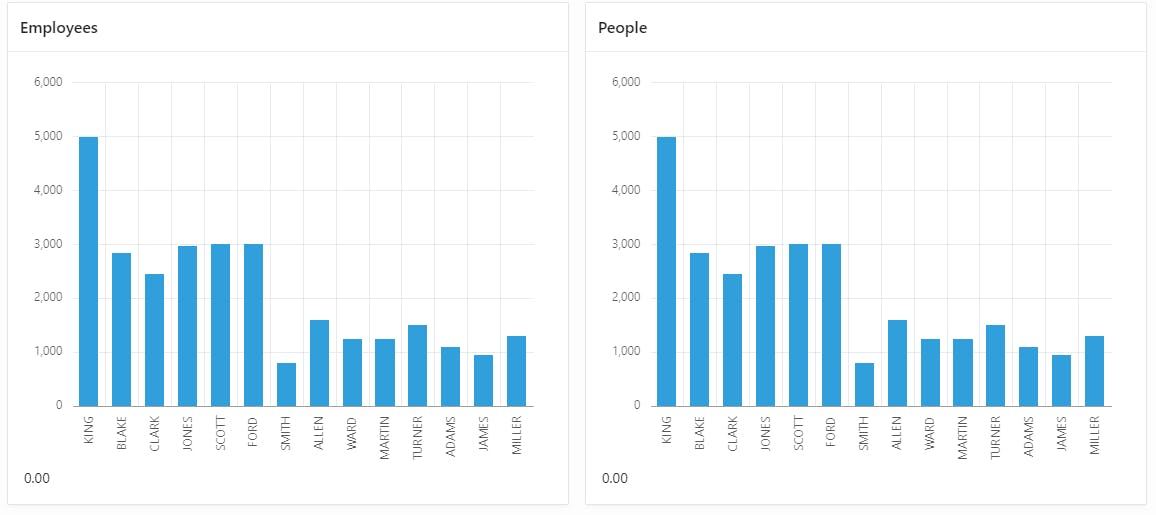
We have timings on both charts. Both are 0.00. So, basically the same, wouldn’t you agree?
Well, OK. I now know my charts take 0.00 seconds. Why only two decimal places, though? The debug shows five decimal places. Also, who is the intended audience for this? The developer or the user? What’s the user going to do with this information? Not a lot, to be honest. Then, I’d argue this is developer/debug information.
In his blog article, Jorge provides a CSS that allows you to hide this information from the user and reveal it only when the Show Layout Columns button on the APEX Developer Toolbar is clicked.
I agree with Jorge – this is developer information and should be shielded from the user. But what’s this X link at the bottom of Jorge’s article?
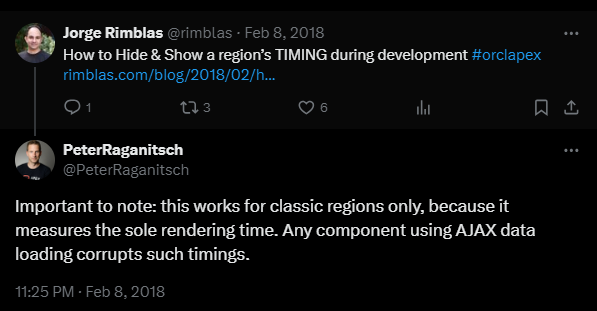
Wait, what? I thought pretty much most of APEX was AJAX data loading components. This is devastating news for #TIMING#! 🙈
Let’s check out what Peter says. Let’s change the People chart – so that it delays for 6 seconds – by changing the source to PL/SQL Function Body returning SQL Query.
DECLARE
  v_start_time TIMESTAMP;
BEGIN
  -- Store the current timestamp
  v_start_time := systimestamp;

  -- Loop until 3 seconds have passed
  WHILE systimestamp - v_start_time < INTERVAL '6' SECOND LOOP
    NULL; -- Do nothing, just wait
  END LOOP;

  -- Your SQL query
  RETURN q'~
    SELECT EMPNO,
           ENAME,
           JOB,
           MGR,
           HIREDATE,
           SAL,
           COMM,
           DEPTNO
      FROM EMP
  ~';
END;
Let’s give it a run:
The People chart takes 6 seconds to run, but the timing is 0.00 seconds. When the chart finally displays (after 6 seconds), let’s look at the debug.
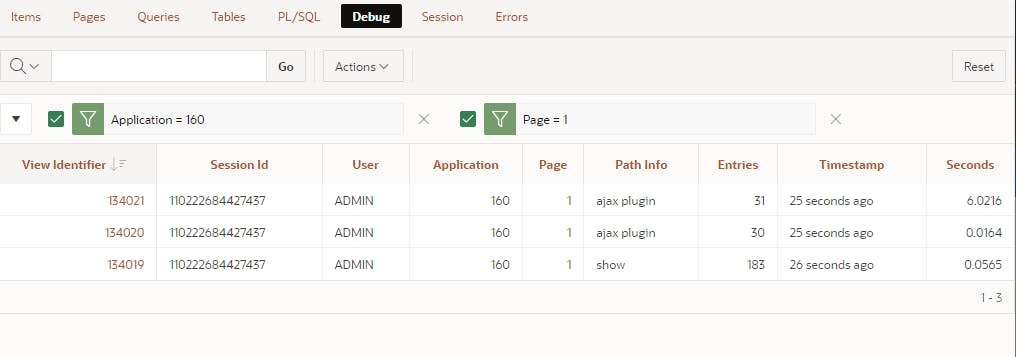
Ah ha! The true timings are all in the debug!
What’s happening here is that it takes 0.00 seconds to render the region’s frame and 6.0216 seconds to fetch the data.
It’s proof that #TIMING# is useless.
But I can’t just leave it like this… I want to fix #TIMING#. But how?
If only I could fix the Path Info (screenshot above) to make it more descriptive. 🤔 Only the APEX Team can do this, though.
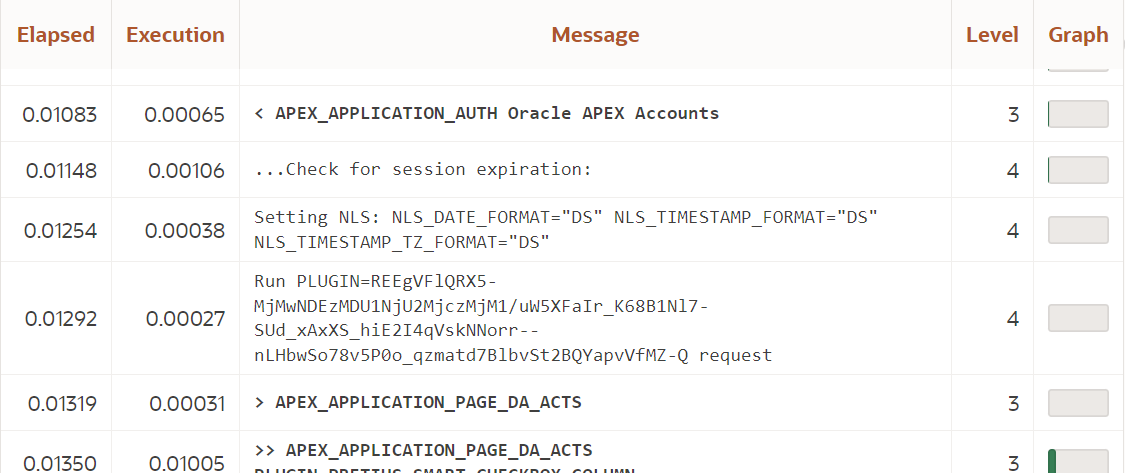
However, a solution – in the form of the AjaxIdentifer – is right there in debug. You’ve probably seen this 1000 times without noticing it’s ever there.
Here it is, right in the middle of the picture below, prefixed by Run PLUGIN=.
if I can match this AjaxIdentifer with Dynamic Actions through apex.da.gEventList…
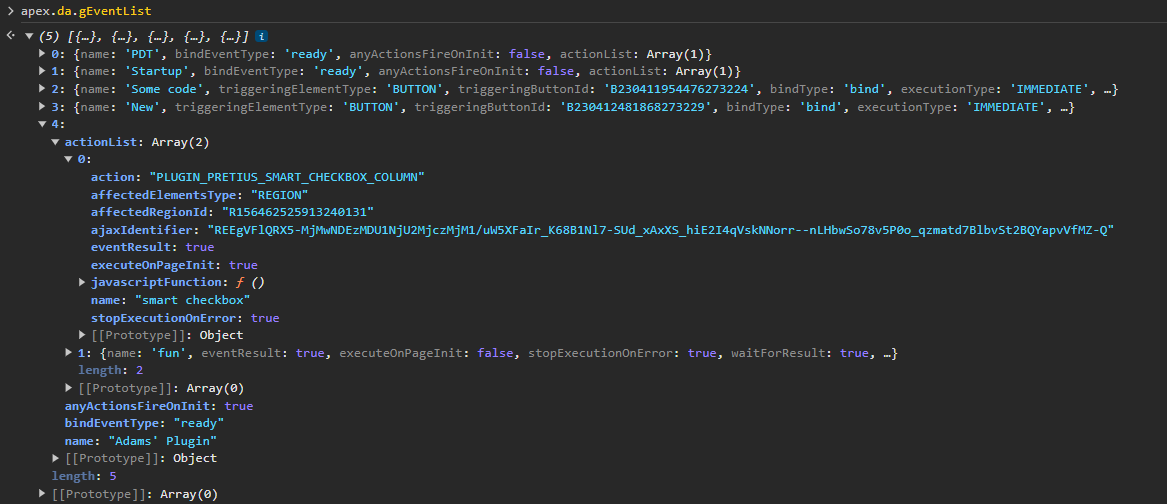
Or Page Source where APEX elements are initialized…
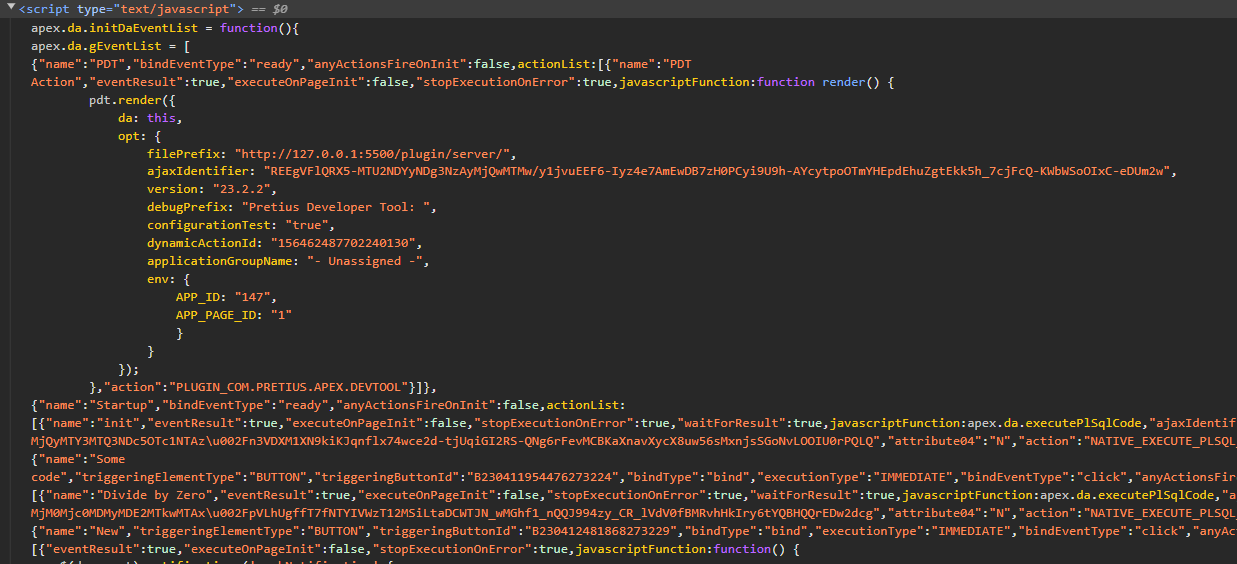
…then I will know which Debug Log is associated with each APEX Component.
As I said, I have no control over the APEX debug – but I do have Pretius Developer Tool that already has a Debug page. So, by examining the Debug Logs and using some insane regular expressions, I can parse out all the AjaxIdentifers, and then associate the AJAX Plugin Debug Logs with the APEX Components 🤓
I’m talking about this level of regular expression insanity:
/apex\.widget\.tree\.init\s*\(\s*'R([^']+)_tree',.*?"regionStaticId":"([^"]+)",.*?"ajaxIdentifier":"([^"]+)"/g;
All this has now been coded into version 23.2.2 of the Pretius Developer Tool and is totally free to use. Let’s see the final work in action:
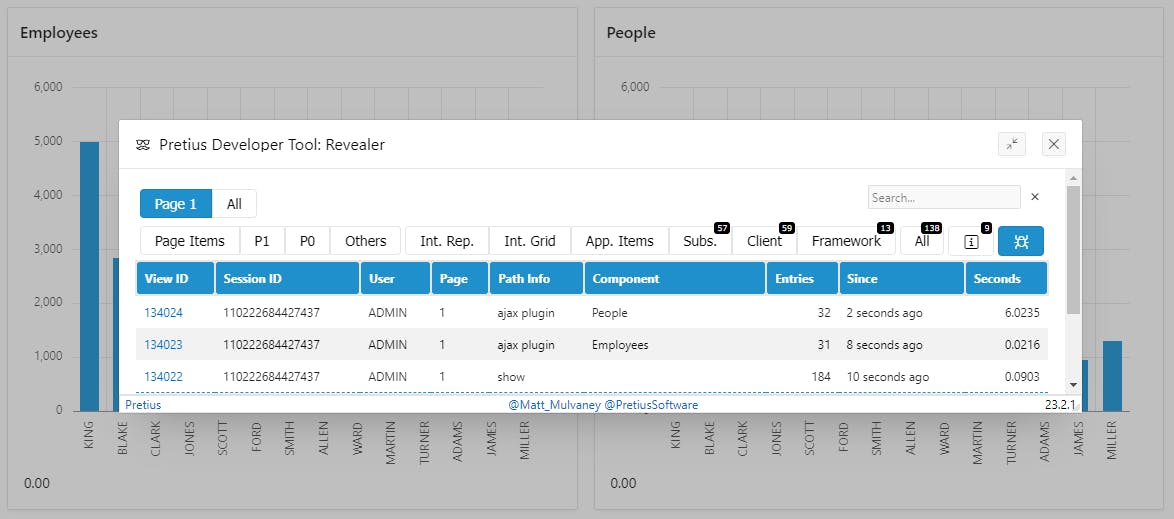
The above picture is the Pretius Developer Tool, showing the association between AJAX Plugin Debug Logs and APEX Components. As you can see from the new Component column, the People region takes 6.0235 seconds, and the Employees region takes 0.0216 seconds (not 0.00 seconds).
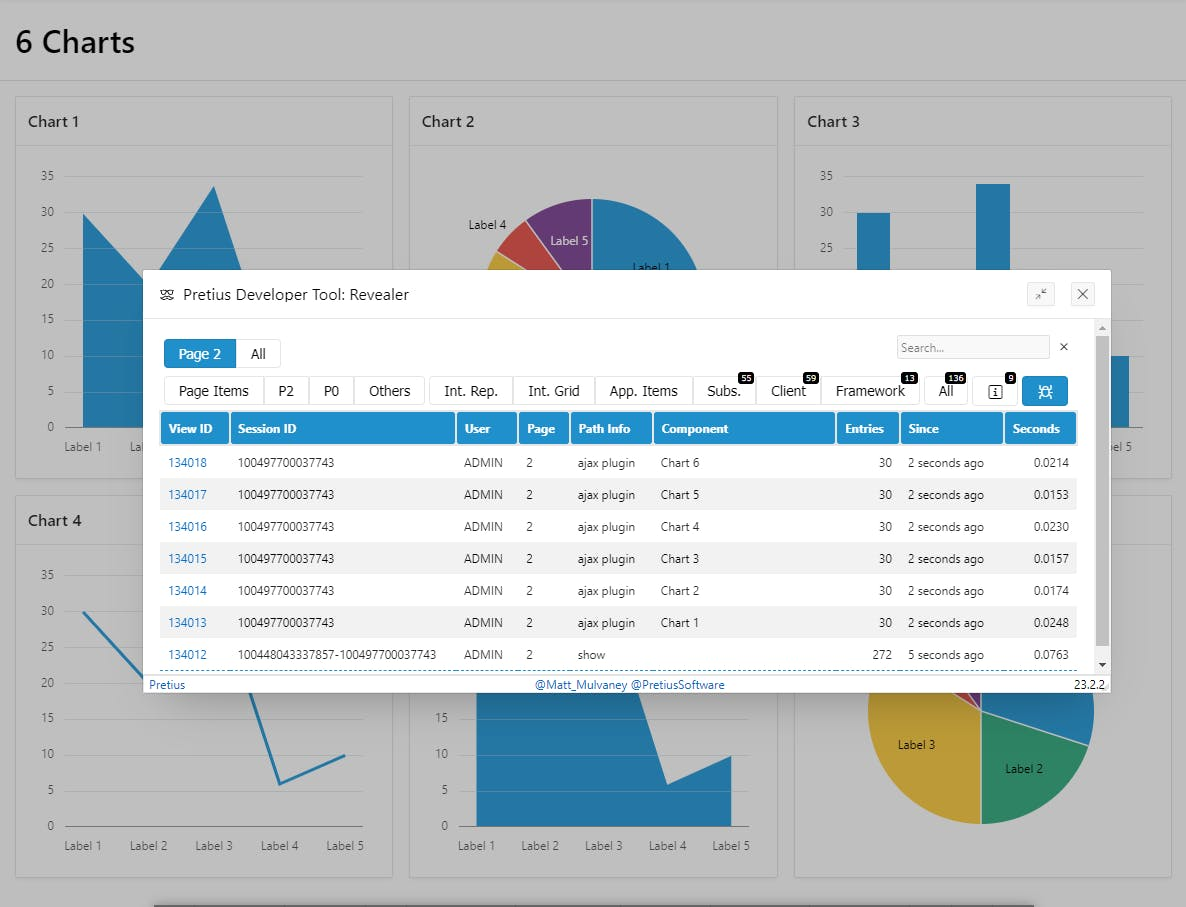
This functionally works on the majority of components. Here’s the Dashboard Feature page:
It also supports items, i.e. Combobox, facets, radios, etc. You’ll need to check the readme file for a full support list. However, due to some inconsistencies in APEX, some components fail to log the AjaxIdentifer in the debug, making this approach impossible to support the following:
Perhaps the APEX Team could fix this in a future release?
Here is another screenshot showing Dark Mode support, Plugin Support, Execute Server Side Code Dynamic Actions and Region Display Selector.
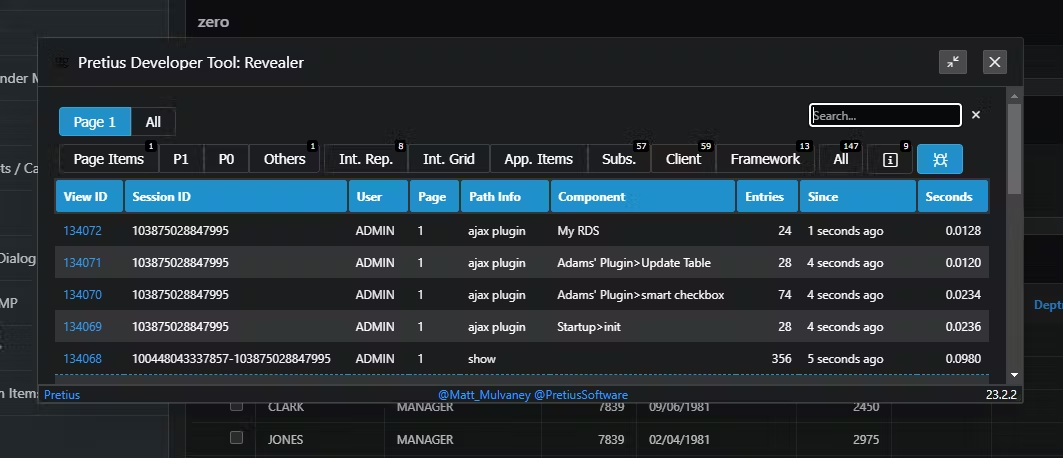
Notice that debug logs are grouped by page load so that you can see exactly what happens after each page load.
And that’s about it for this article. I urge you to try out the Pretius Developer Tool, as it does provide much more functionality, including:
Moreover, if you’re interested in Oracle APEX, check out some of the other articles on our blog, namely:


