Pretius. Built Smarter: Strategic merger as an answer to modern challenges
Pretius. Built Smarter:
Strategic merger as an answer to modern challenges

How Pretius modernized a nationwide fiber-network monitoring system

decorative image

Company

Country

–

Industry

Telecommunications

System

Network monitoring / Topology visualization

Executive summary: An evolution, not a rewrite, of a mission-critical monitoring platform

01

Client

The client is a national telecommunications operator in Central Europe, running one of its country's nationwide fiber-optic networks. Its network-monitoring system is the tool that the operator's own staff and its business customers use to monitor that network. When a monitoring platform sits on top of national telecom infrastructure, its clarity and performance are not cosmetic concerns. They directly shape how quickly operators can see what's happening and react when something goes wrong.

02

The core challenge

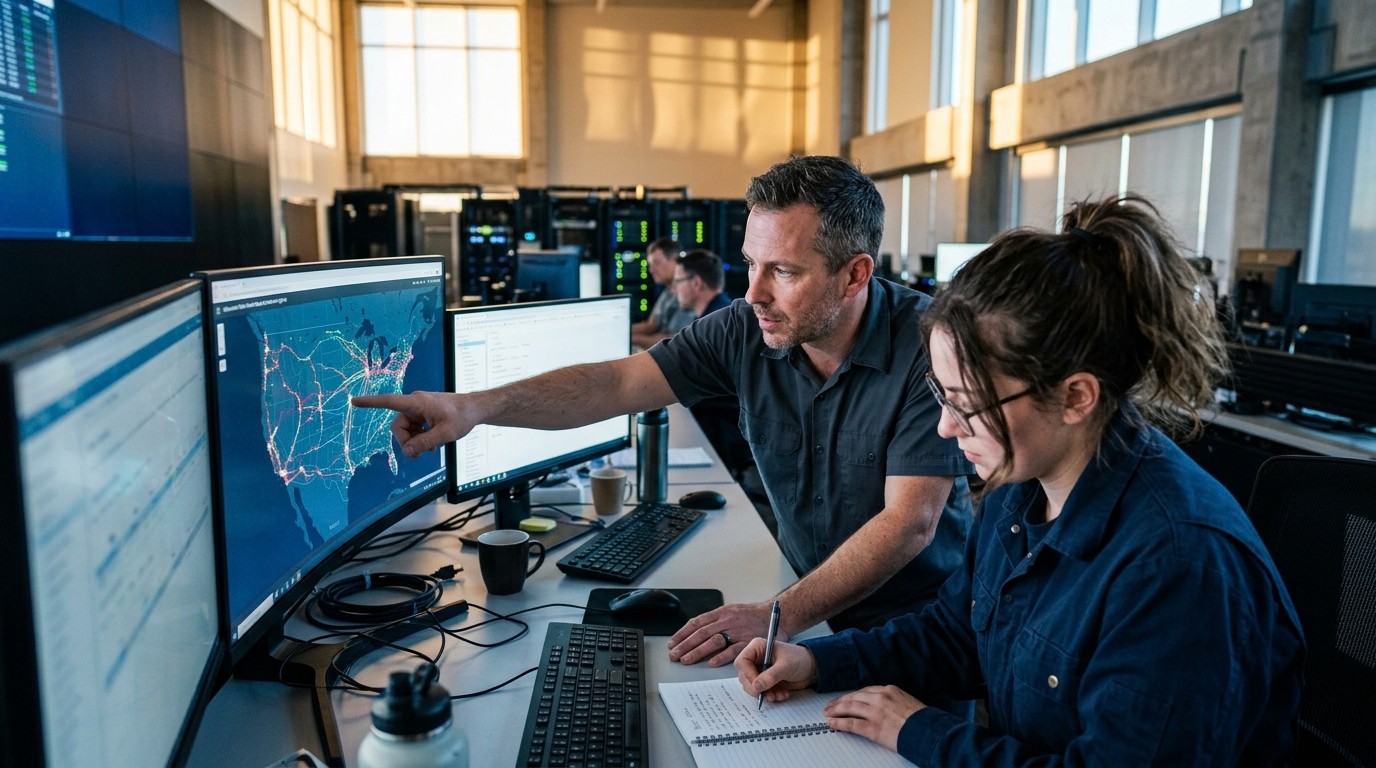
The existing system had accumulated problems in code quality, architectural performance, and interface consistency. Different modules added objects and displayed details in different ways, which slowed daily operational work, and the platform struggled to stay responsive at the scale of the network it had to represent. The defining technical challenge was visualizing an enormous number of devices, up to 4,000, while keeping the view legible and the system fast. For the business, the consequences were concrete: harder SLA monitoring and slower reaction to network events.

03

Solution delivered

Rather than rewrite a working system, Pretius ran a comprehensive technical and functional audit and used it to design the next major version of the platform, an evolution built on a rebuilt Angular front end and an optimized Java back end. The work introduced an extended network-topology management model, unified the interface around shared patterns, integrated Grafana for statistics, and ran on a co-development model in which Pretius owned the front end while the operator's team owned the back end. The engagement delivered complete analytical documentation, UX/UI mockups, and an implementation backlog, and its success led the operator to extend the partnership with further development work.
Key outcomes:
  • A modernized, consistent interface:
    The new version replaced a fragmented UI with unified patterns for adding objects, viewing details, and filtering, making everyday operational work faster and less error-prone.
  • Topology at network scale:
    A performant topology module visualizes up to 4,000 devices, giving operators full visual insight into the network.
  • Grafana-powered statistics:
    Integration with Grafana brought monitoring statistics directly into the operator's workflow.
  • A partnership that grew:
    The smooth delivery of the analysis and front-end rebuild earned Pretius further development work in the following phase of the collaboration.

Client background

The client is a national telecommunications operator in Central Europe that runs a nationwide fiber-optic network. Its platform is a network-monitoring system used both by the operator's own operational staff and by its business customers, who rely on it to keep visibility over the services that run across that infrastructure.

Network monitoring is an unforgiving domain. The people using the tool are often watching for the early signs of a fault, tracking whether services are meeting their SLAs, and deciding how urgently to respond. Everything about the interface either helps them do that quickly or gets in their way. When the same action is performed differently in different parts of the system, or when a topology view slows to a crawl because there are too many devices on screen, the cost is not just irritation. It is slower detection and slower reaction on infrastructure that carries real traffic for real customers. That is the context in which the existing system had begun to show its age, and it is why modernizing it was an operational priority rather than a nice-to-have.
decorative image

The business challenge: A capable system held back by inconsistency and scale

The existing system did its job, but three weaknesses were quietly taxing the people who depended on it every day.
The first was consistency. Over time the interface had drifted, so different modules offered different ways of adding objects and displaying their details. Each inconsistency is small on its own, but together they force users to re-learn the system module by module, and they slow down work that should be reflexive. The second was performance at scale. As the number of monitored devices grew, the platform struggled to stay responsive, and the topology view in particular became difficult to use at the scale the network actually required. The third was a gap in capability: the system lacked the more advanced topology-management features operators needed to reason about the network as a whole.

Taken together, these created real operational pressures:

  • Inconsistent interaction patterns:
    Different modules handled the same tasks differently, lowering efficiency and adding cognitive load to routine operational work.
  • Performance under device scale:
    The system strained as the device count climbed, undermining exactly the large-scale views operators most needed.
  • Limited topology management:
    Without advanced topology features, managing and understanding the network's structure was harder than it should have been.
  • Business consequences:
    The net effect was harder SLA monitoring and slower reaction to network events, which is precisely what a monitoring platform exists to prevent.

Why an evolution, not a new system

Faced with a system showing this many strains, the tempting move is a clean-sheet rewrite. Pretius and the operator deliberately chose evolution instead, and the reasoning is worth spelling out because it reflects sound engineering economics rather than caution for its own sake.
The parts of the existing system that worked, worked well. The existing infrastructure, including the REST integrations with network drivers and the Kafka message broker, was functioning correctly and carrying real operational load. Ripping all of that out to rebuild from scratch would have thrown away proven, stable components, and it would have been unjustifiable on both cost and timeline. The problems that actually needed solving were concentrated in the front end, the interface consistency, and specific back-end performance paths, not in the foundational integrations. So the right answer was to target the modernization precisely where the pain was: rebuild the front end, optimize the back end where it mattered, and leave the healthy integration layer in place. This is the discipline of evolution over rewrite, spending effort where it changes outcomes and preserving what already earns its keep.

The solution: A targeted rebuild delivered through co-development

decorative image
Pretius began with a comprehensive technical and functional audit of the existing system, and that audit became the foundation of the new design. The solution rebuilt the front-end layer on Angular 11 and optimized the Java 11 back end, concentrating engineering effort on the areas the audit identified as holding the system back.

Three elements defined the build. An extended network-topology management model gave operators richer ways to manage and visualize the network's structure. An integration with Grafana, embedded through iframes with dedicated navigation into the statistics, brought monitoring metrics into the operator's flow. And a systematic unification of the interface established shared patterns for adding objects, displaying details, and filtering, so that the system finally behaved consistently from module to module.

The engagement ran as a fixed-price project using Agile methods, and its defining organizational feature was a co-development model. Pretius owned the front end while the operator's own architects and back-end developers owned the back end. This arrangement solved a real problem, namely the client's gap in front-end capacity, by pairing Pretius's front-end expertise with the operator's deep knowledge of its own back-end systems. It was not the path of least resistance. Co-development only works with tight synchronization and clearly defined API contracts between the two sides, and getting that coordination right was itself a significant part of the work.

The project was structured across distinct stages, with analysis, UX/UI, and development running in the first stage from September to December 2022, and a second stage covering topology and data-synchronization optimization running from November 2022 to February 2023. An optional third stage extended the work toward dashboards and deeper Grafana integration in early 2023.

The delivery was built around three connected pillars:

01

A unified, modernized interface

The front-end rebuild introduced standard components and shared interaction patterns, for example a consistent pop-up configuration approach, so that adding objects, viewing details, and filtering work the same way everywhere. The hard part was not designing the new standard but applying it across many existing modules without interrupting their operation, retrofitting consistency into a live system rather than a blank slate.

02

A topology module built for scale

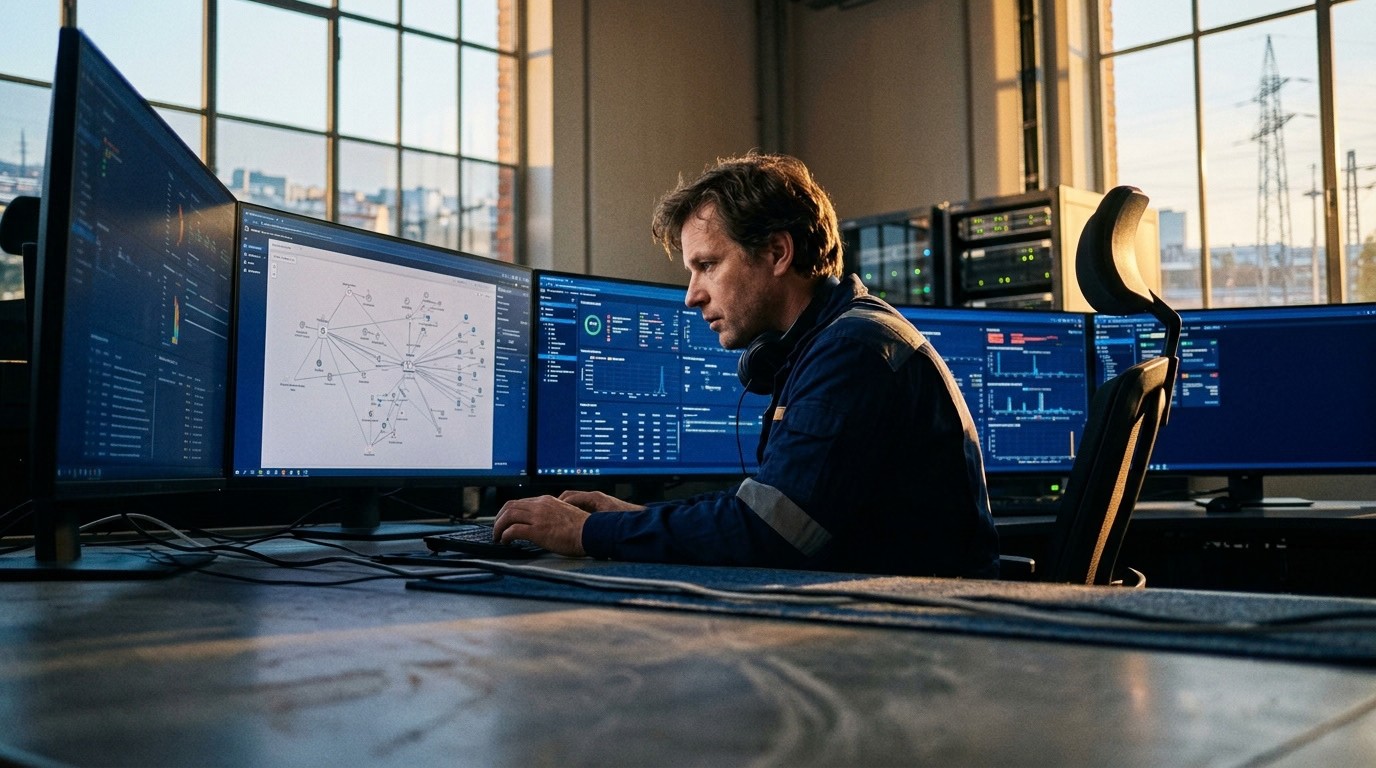
The topology module visualizes the network's devices at genuine scale, up to 4,000 of them in a single view. This was the project's headline technical demand, and it lived or died on browser rendering performance: putting thousands of interactive elements on screen without the view becoming sluggish is a real engineering problem, not a matter of drawing more shapes.

03

Grafana-integrated statistics

Rather than send operators to a separate tool, the new version embeds Grafana views directly, with dedicated transitions into the relevant statistics. Monitoring metrics live where the operator is already working, which is exactly where they are most useful.

Technologies and key architectural decisions

The stack was chosen to fit an evolution strategy, modern where the rebuild demanded it and stable where the existing system was already sound.
Angular logo

A rebuilt Angular front end

The front end was rebuilt on Angular 11, the layer where most of the previous version's inconsistency and usability problems lived, and therefore where a fresh, standardized implementation delivered the most value.
An image showing Java logo.

An optimized Java back end

The back end runs on Java 11 with Spring, optimized rather than replaced. The focus was on the performance paths that mattered, particularly the data-synchronization mechanism addressed in the second stage, while preserving the integrations that already worked.
postgresql logoMongoDB_Logo_0

A dual-store data layer

The system uses PostgreSQL alongside MongoDB, pairing a relational store with a document store to fit the different shapes of data a monitoring platform has to handle.
grafana-labs-logo

Preserved integrations and infrastructure

The healthy parts of the existing system were kept: REST integrations with network drivers, Kafka as the message broker, and Grafana for statistics, all running on Docker. Retaining this layer is what made the evolution approach both possible and economical.

The team

Pretius delivered the project with a compact, cross-functional team: a business analyst, a tester, a UX/UI designer, a front-end developer, a back-end developer, and a project manager, working in an Agile, fixed-price, co-development setup alongside the operator's back-end architects and developers.

Navigating the hard parts: risks and the UX-versus-business tension

Like any tightly scheduled modernization, this project carried real risks, and the team went in having named them in advance. Most of what could go wrong was anticipated and planned for, which is why the stages delivered on schedule.
decorative image

01

A tight timeline across overlapping stages

The compressed schedule for the first two stages was rated a high risk from the outset. The mitigation was to run work in parallel and deliver the backlog Epic by Epic against the plan, so that progress was continuous and visible rather than backloaded into a risky final push.

02

Dependence on the client's back-end team

Because the back end sat with the operator under the co-development model, progress on the front end depended on timely input from the client's side, a medium risk the team recognized early. It was managed by establishing dedicated points of contact on the client's side, so the two teams could keep API contracts and dependencies synchronized rather than waiting on ad-hoc coordination.

03

No ready development environment

The absence of a prepared development environment was another anticipated, medium-level risk. Instead of waiting on access procedures to be provisioned, the Pretius team stood up the environment locally and kept moving, removing a dependency that could otherwise have stalled the start.

04

The 4,000-device visualization: a deliberate trade-off

One decision deserves to be stated plainly, because it reflects honest engineering rather than a tidy success story. Pretius's own UX audit recommended limiting the number of elements shown at once, on the grounds that 4,000 devices in a single view is difficult for a user to read. The client nonetheless required full-scale visualization for the business insight it provided. The team implemented it as requested, meeting the business need while being clear-eyed about the readability trade-off it involved. Documenting that tension, rather than papering over it, is part of what made the analysis genuinely useful for the platform's future direction.

Measured outcomes and business impact

A modernization that delivered a working system, a clear plan for its future, and a deeper client relationship.

Decorative image

A modernized platform

The client came away with a refreshed, consistent interface layered onto a system whose sound foundations were preserved, improving the daily experience without discarding what already worked.
Decorative image

Topology visualization at scale

A performant topology module capable of visualizing up to 4,000 devices gave operators full visual insight into a large network, the project's central technical goal, delivered.
Decorative image

Complete documentation and a ready backlog

Beyond the running software, the engagement produced complete analytical and technical documentation, UX/UI mockups, and a structured implementation backlog of Epics, giving the operator a clear, actionable basis for further development.
Decorative image

Streamlined monitoring of services and alarms

The unified interface and optimized back end translated into a smoother process for monitoring services and handling alarms, directly addressing the SLA-monitoring and reaction-time problems that motivated the project.
Decorative image

A partnership that continued

The efficient delivery of the analytical stage and the front-end rebuild led directly to an extension of the collaboration, with further development work entrusted to Pretius in the following phase. The operator is also cited internally as one of the key inbound leads that converted into a lasting client relationship.

Conclusion

This project shows how a disciplined audit and an evolution strategy can modernize a mission-critical system without the cost and risk of a full rewrite.

The operator did not need its network-monitoring platform torn down and rebuilt from nothing. It needed the parts that were hurting daily operations fixed, namely a fragmented interface, performance that buckled at scale, and missing topology capability, while the proven integration layer underneath stayed exactly where it was. By starting with a thorough technical and functional audit, rebuilding the Angular front end, optimizing the Java back end where it counted, and running the whole thing as a tightly synchronized co-development effort, Pretius delivered a modernized platform that visualizes the network at full scale, unifies the operator experience, and comes with the documentation and backlog to keep evolving.

The clearest verdict on the work is the client's own response to it: a smooth delivery that turned into an extended partnership and further development. For any organization weighing a rewrite against a targeted modernization, this project is a reminder that the most valuable engineering decision is often knowing what not to rebuild.
decorative image

Looking for a software development company?

Work with a team that already helped dozens of market leaders. Book a discovery call to see:

  • How our products work
  • How you can save time & costs
  • How we’re different from other solutions

footer-contact-steps

We keep your data safe: ISO certified

We operate in accordance with the ISO 27001 standard, ensuring the highest level of security for your data.
certified dekra 27001
© 2026 Pretius. All rights reserved.