
When working with maps in Oracle APEX, we often assume that what we see reflects reality. But surprisingly, what you see on a map might be very far from the truth.
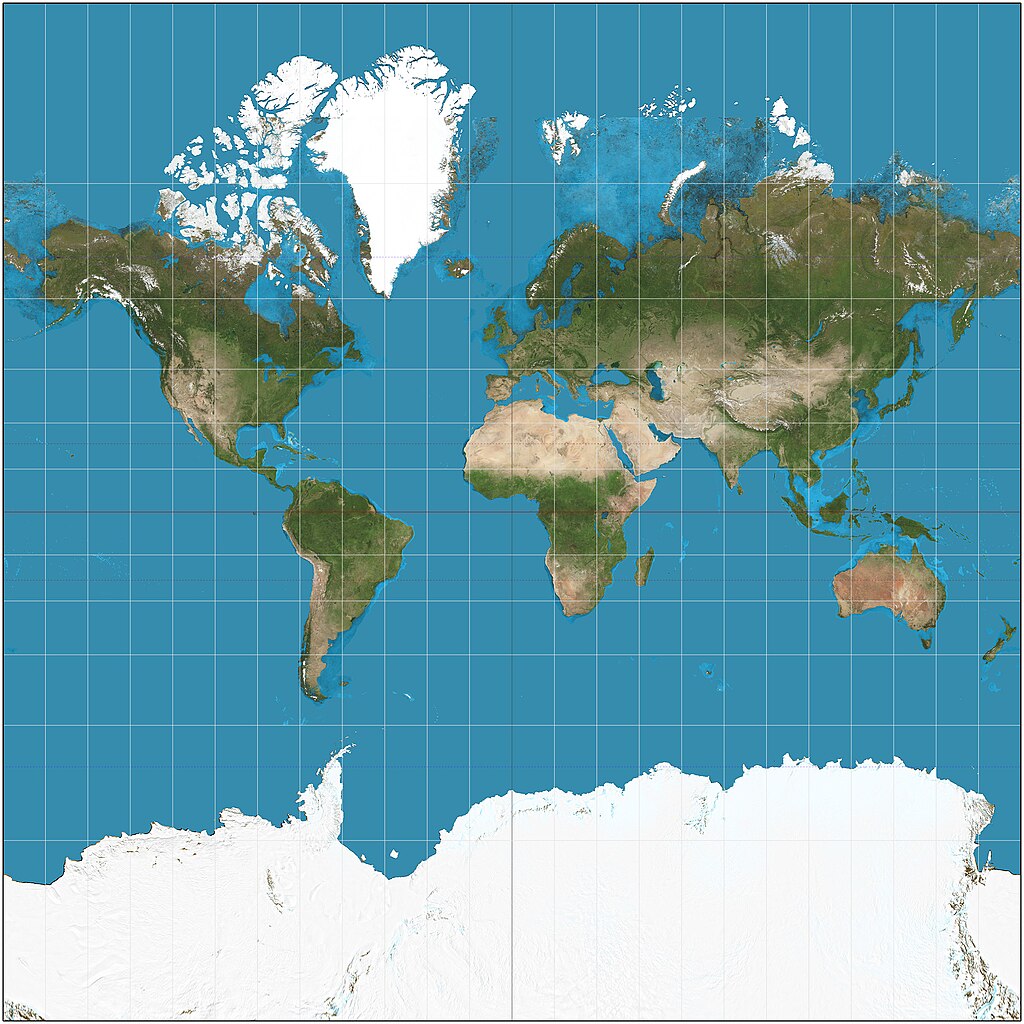
Let’s take an example: on many world maps, Greenland looks almost as big as Africa, sometimes even bigger. But when we measure the real size, the difference is massive.
Such spatial illusions—differences in what we perceive and reality—can be caused by several factors. In this article, I’ll highlight some of them, namely:
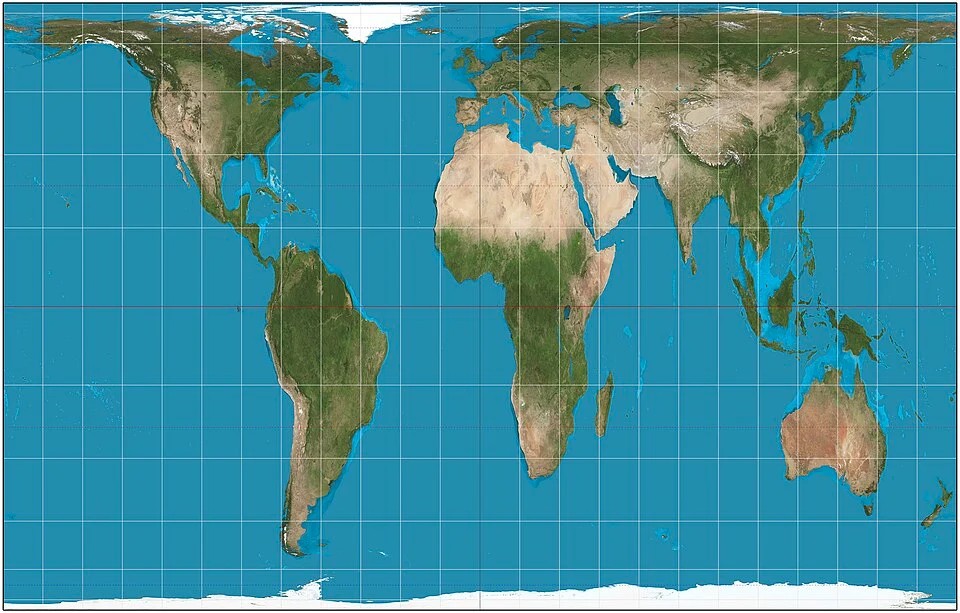
Let’s start with Map projections. To understand the problem, we need to start with a basic fact: the Earth is round, but maps are flat.
To display the surface of a 3D sphere (like the Earth) on a 2D map, we need to “unwrap” or “flatten” the globe. This process is called a map projection.
Unfortunately, it’s impossible to flatten a sphere without causing some distortion. Think of peeling an orange and trying to lay the skin flat—it doesn’t fit perfectly. You either have to cut, stretch, or compress parts of it. This is exactly what happens when we project the Earth onto a flat map.

Every map projection tries to preserve some aspects of the Earth, like shape, area, distance, or direction, but none can maintain everything at once.
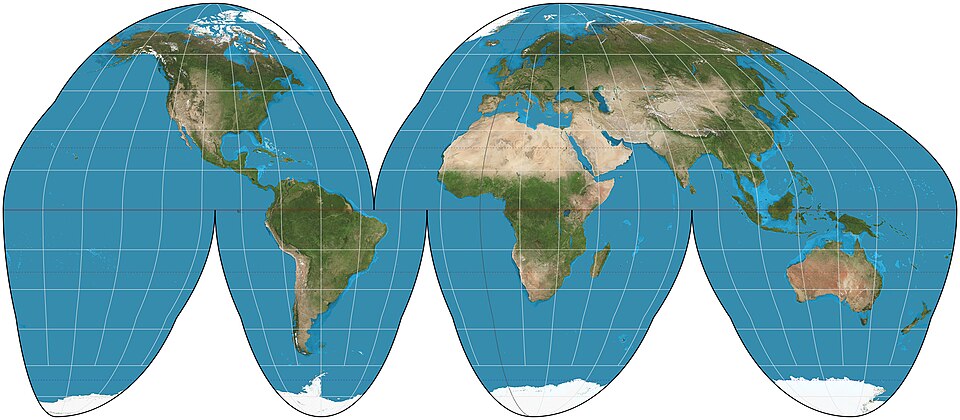
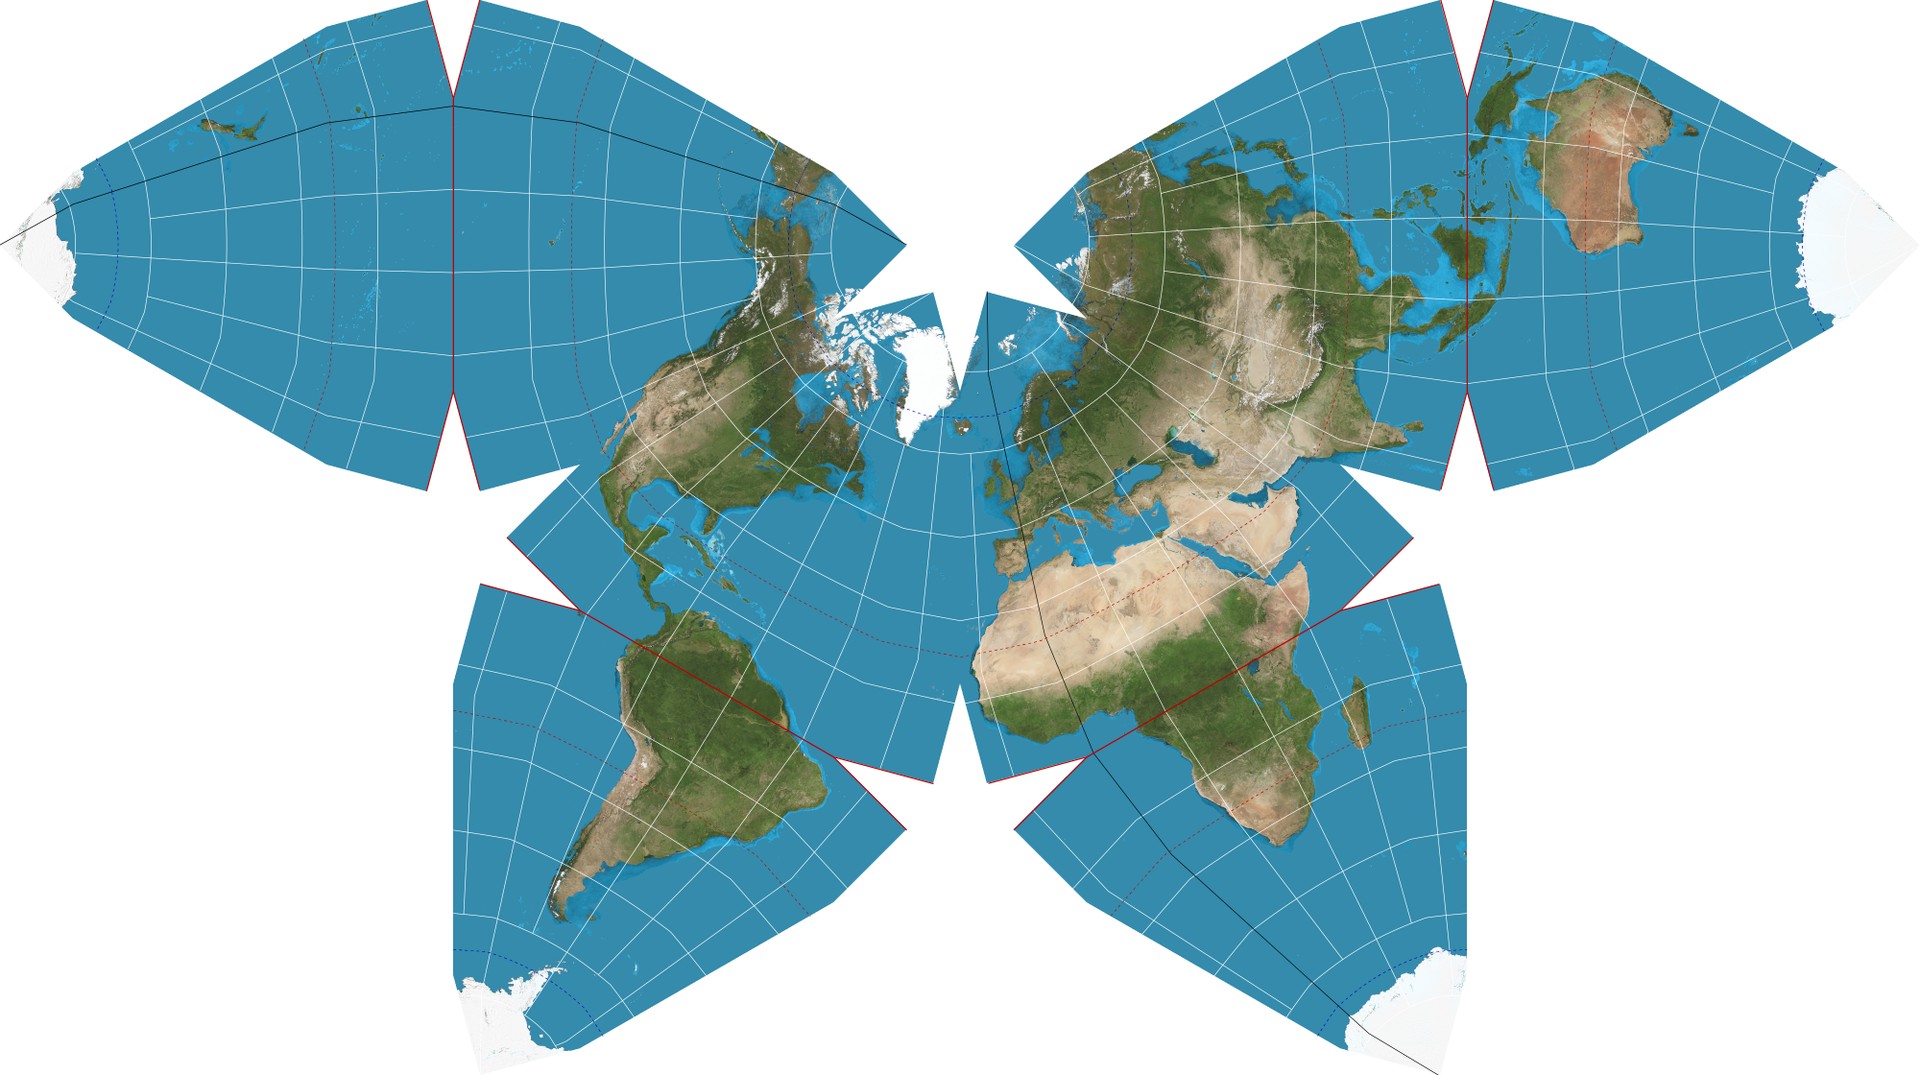
One way to understand this is by visualizing it. Imagine the globe cut into pieces and opened up like petals or flattened like puzzle parts. That’s what map projections do—they try to lay the Earth flat in different ways.
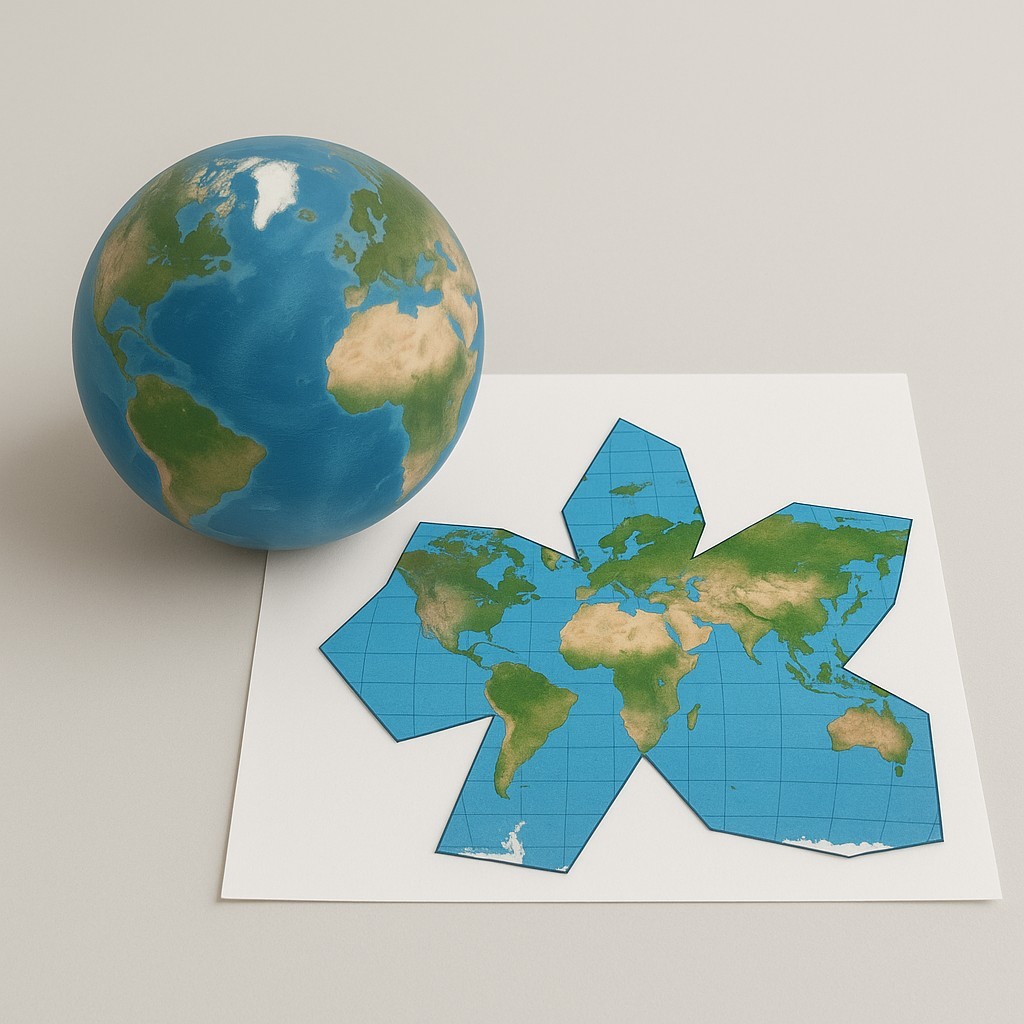
Some projections cut the oceans to preserve land shapes better. Others distort the poles to keep navigation directions correct.
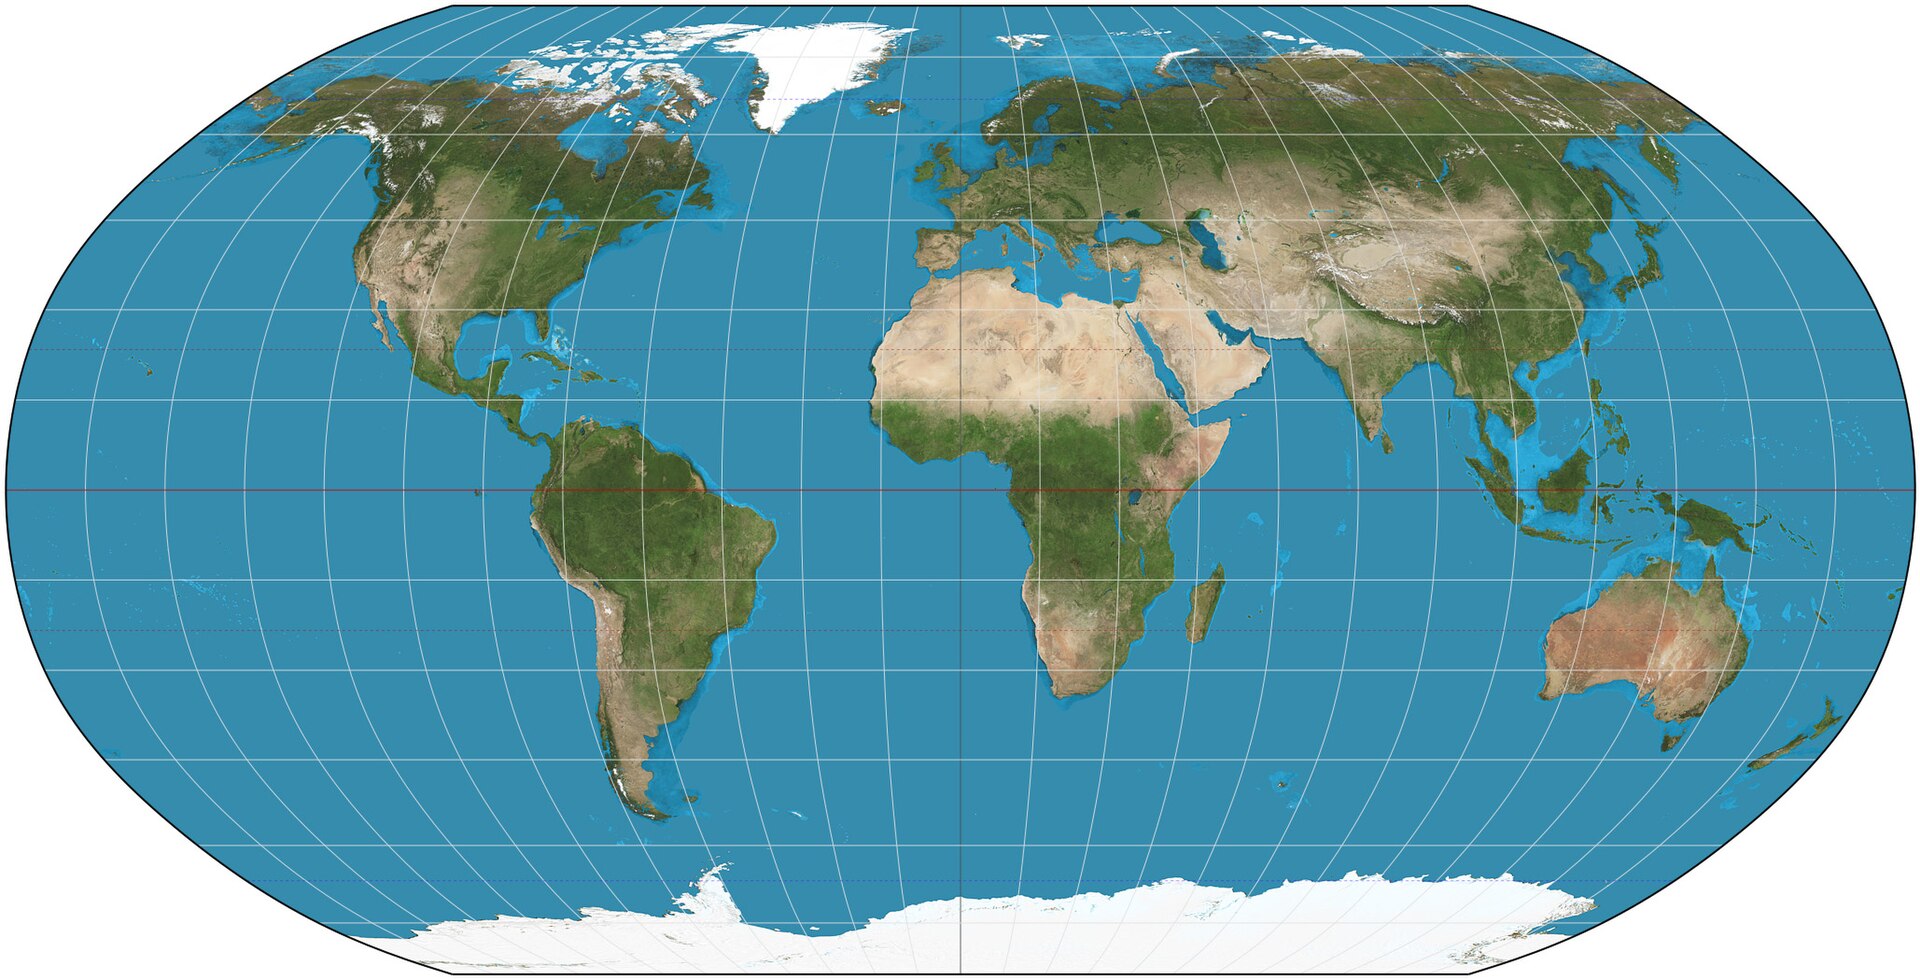
Over the years, many different types of projections have been developed. Each has its strengths and weaknesses. Let’s look at a few:
Source: Wikipedia
Source: Wikipedia
Source: Wikipedia
Source: Wikipedia
Source: Wikipedia
When we use maps in Oracle APEX—for example, with Map Regions—we’re using a web mapping system that relies on a standard projection called Web Mercator, also known as EPSG:3857. Popular platforms, such as Google Maps and OpenStreetMap, use this projection. It’s fast and works well for dynamic, interactive maps, but it comes with the same distortion problems mentioned earlier.
So next time you’re building a map in APEX and wondering why Greenland looks so big, you’ll know it’s not a data error – it’s just the projection doing its job!
Choosing the wrong map projection can lead to serious misunderstandings, especially in applications that rely on accurate spatial data, such as logistics, urban planning, environmental studies, or business dashboards.
Here are some common problems caused by using the wrong projection:
Now it’s time to go a step further and talk about something just as important in the world of mapping: Coordinate Reference Systems or CRS.
A Coordinate Reference System is a system that tells us how to describe the position of things on Earth using numbers, usually latitude and longitude (but not always).
You can think of a CRS as a set of rules that define:
In simple terms, a CRS tells your computer how to understand and draw geographic data correctly on a map.
This is a common point of confusion, so let’s clarify it.
💡Think of it this way: A projection is how we flatten the Earth. A CRS is the full package that tells us how to place, measure, and interpret that flattened Earth.
The EPSG (European Petroleum Survey Group) database, one of the most widely used CRS collections, currently contains over 6,000 different coordinate reference systems!
1.EPSG:4326 – WGS 84 (World Geodetic System 1984)
2. EPSG:3857 – Web Mercator
3. EPSG:32633 / EPSG:25832 – UTM Zone 33N (WGS 84 / ETRS89)
4. EPSG:28992 – Amersfoort / RD New
5. EPSG:2180 – ETRS89 / Poland CS92
There are many reasons for the existence of multiple Coordinate Reference Systems. Here are some of the key factors:
1. The Earth is round, but maps are flat: When representing the the round Earth on a flat map, deformations occur, either in shape, distance, or area. Each country adopts a CRS that minimizes these deformations for its specific region.
2. Different needs of countries
3. Legacy systems vs. modern standards: In the past, countries developed their own CRS systems. While many now use modern standards like ETRS89, some older systems are still in use for historical data compatibility.
4. Higher accuracy
5. Legal regulations: Many countries have legal requirements for land surveying, construction, and land ownership records, which dictate the use of specific CRS systems.
SDO_GEOMETRY is a data type Oracle uses to represent geometric objects such as points, lines, and polygons in a database. It enables users to store, query, and manage spatial data efficiently. The SDO_GEOMETRY object consists of the following attributes:
You can read more about the SDO_GEOMETRY type HERE. Below is an example of an SDO_GEOMETRY representation for a polygon:
SDO_GEOMETRY(
    2003, --SDO_GTYPE = SDO_POLYGON2D
    4326, --SDO_SRID = WGS84
    NULL, --SDO_POINT is null (geometry for polygon)
    SDO_ELEM_INFO_ARRAY(1, 1003, 1), --polygon description
    SDO_ORDINATE_ARRAY( --coordinates
        20.7533776504406 52.3973224996299,
        20.7533776504406 52.0959234112862,
        21.3046961460238 52.0959234112862,
        21.3046961460238 52.3973224996299,
        20.7533776504406 52.3973224996299
));
On the map, it looks like this:
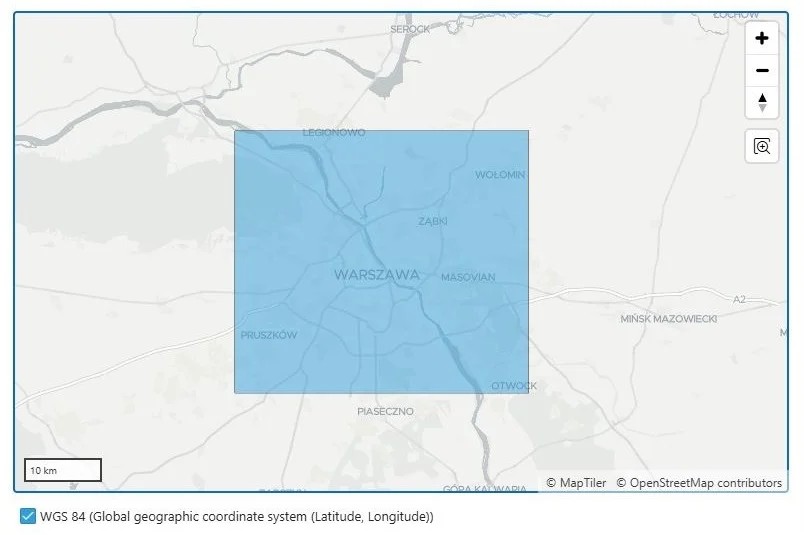
Now that we know how to store a polygon’s geometry in the database using the EPSG:4326 – WGS 84 coordinate system, how can we convert it to a different CRS?
The answer is simple: we can use the SDO_CS.TRANSFORM function.
SDO_CS.TRANSFORM(
     geom IN SDO_GEOMETRY, --my geometry
     to_srid IN NUMBER --the coordinate system to be used for the transformation
 ) RETURN SDO_GEOMETRY;
After applying this function to our polygon, we can see that its coordinates change significantly depending on the coordinate system used:
| CRS_CODE | DESCRIPTION | WKT_GEOMETRY |
| 4326 | WGS 84 | POLYGON ((20.7533776504406 52.3973224996299, 20.7533776504406 52.0959234112862, 21.3046961460238 52.0959234112862, 21.3046961460238 52.3973224996299, 20.7533776504406 52.3973224996299)) |
| 28992 | Amersfoort / RD New | POLYGON ((1195334.93117735 600956.467056177, 1202452.02410556 567953.574939523, 1239613.12367566 576107.860486178, 1232239.92224748 609071.503559281, 1195334.93117735 600956.467056177)) |
| 3857 | Web Mercator | POLYGON ((2310255.43228755 6872287.76510974, 2310255.43228755 6817488.25512738, 2371627.92648079 6817488.25512738, 2371627.92648079 6872287.76510974, 2310255.43228755 6872287.76510974)) |
| 25832 | ETRS89 / UTM Zone 32N | POLYGON ((1298248.640173 5870497.52280419, 1303733.48090739 5837157.35071688, 1341287.87480859 5843471.81897556, 1335541.01421582 5876793.52203226, 1298248.640173 5870497.52280419)) |
| 2180 | ETRS89 / Poland CS92 | POLYGON ((619261.204283513 504934.721819027, 620072.254252523 471424.824759142, 657822.459069308 472480.111600791, 656756.236629756 505987.153750134, 619261.204283513 504934.721819027)) |
Now, I will use the geometry of my polygon with two different coordinate systems.
In previous articles on my personal blog, I have written extensively about creating layers, so I won’t repeat that information here. However, if you need this information, I encourage you to read more about layers HERE, HERE, and HERE.
Getting to the point: for each CRS, I created a separate layer. I also set up two Map Regions to present the results more clearly.
Here’s how our polygon looks in:
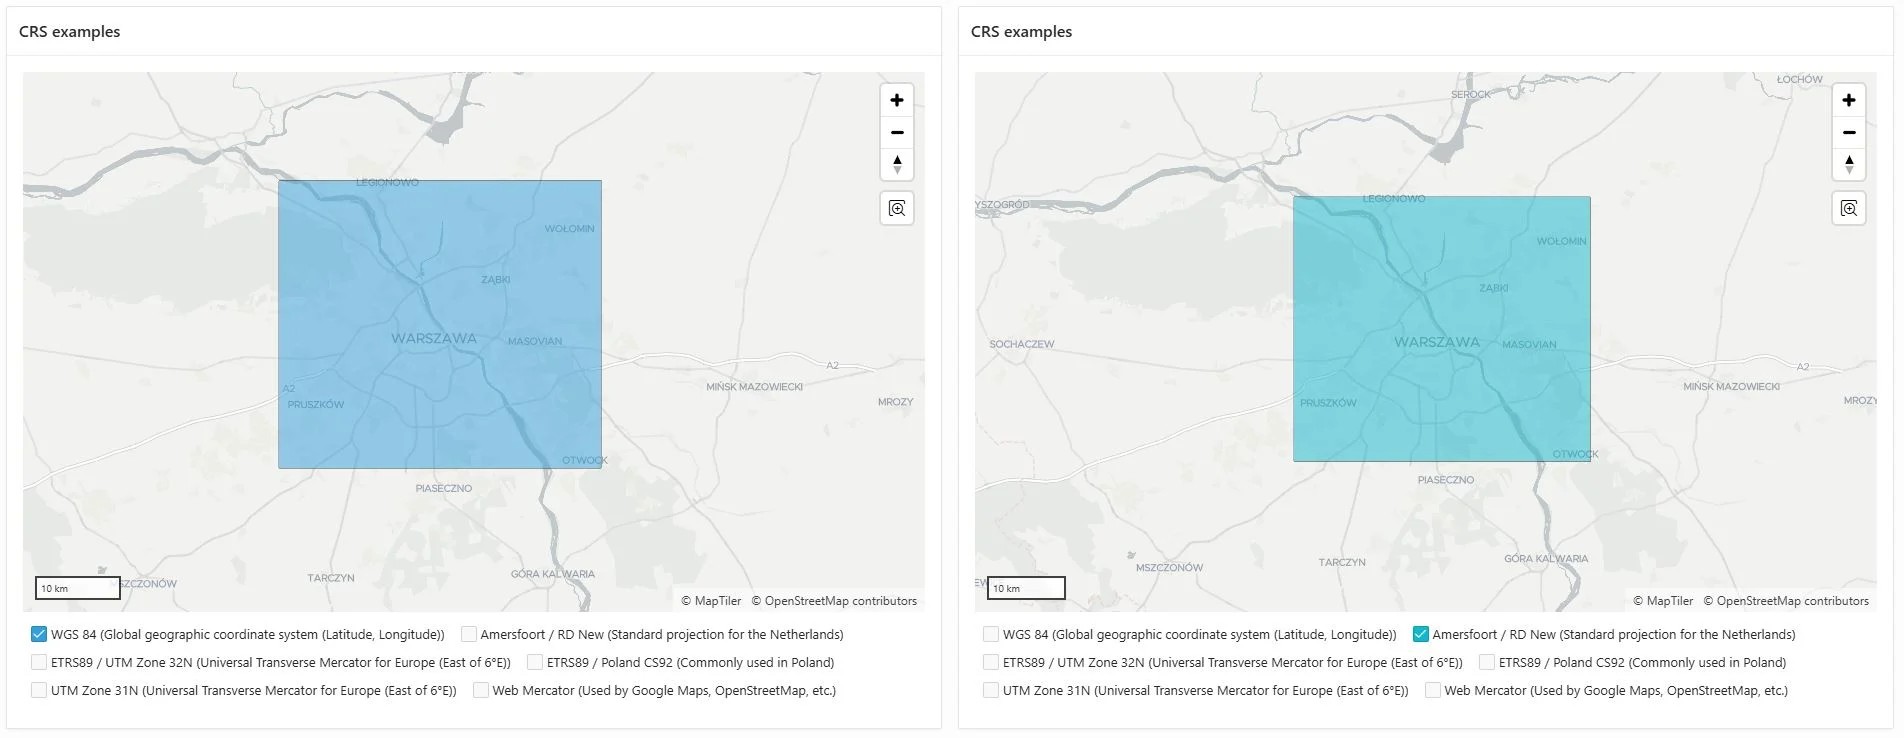
As you can see, both polygons look pretty much identical. Why? Because APEX automatically converts CRS. When you use a Map Region in Oracle APEX, it does something very helpful:
Oracle uses a built-in function called SDO_CS.TRANSFORM to do this conversion.
Even though the geometries are in WGS 84 (latitude and longitude), the map background uses a projection called Web Mercator (SRID 3857).
So what happens is:
That’s why everything looks correct and in the right place, even when your data comes from different CRS.
💡Oracle APEX reads the CRS (SRID) of your data and automatically converts it to WGS 84. Then, it displays the geometry on a Web Mercator map. That’s why all your polygons look correct, even if they are stored using different coordinate systems (of course, as developers, we should still know how our spatial data is stored. It’s not just about displaying it – it also needs to be accurate and work well with other systems!
Even though APEX displays data in WGS84, this does not mean the data is actually stored in this CRS in the database.
A common scenario:
For external users, the CRS in which the data is stored can be crucial, especially if they use different mapping systems.
Lastly, we’ll take a closer look at functions like SDO_ANYINTERACT, SDO_RELATE, and SDO_INSIDE. I’m not going to rewrite the documentation or explain all the differences between them. Instead, I want to focus on one interesting case that recently confused me a lot. So, what happened? In APEX, I created a Map Region that showed the entire area of the United States. I added an extra layer with some points. Next to the map, I made a report showing the list of points that are visible on the map. When I changed the visible area (bounding box), the number of points and the report content also changed. To show the correct points in the report, I used the SDO_ANYINTERACT function in the report’s source. And that’s where the problems began. Let’s recreate this process to better understand where these complications stemmed from and how to avoid them.
First, I created a polygon layer with this SQL:
select
    mdsys.sdo_util.from_geojson('{"type":"Polygon","coordinates":[[
    [-126.51462009328223,28.38314514939684],
    [-69.800481013822,28.38314514939684],
    [-69.800481013822,49.42111619932274],
    [-126.51462009328223,49.42111619932274],
    [-126.51462009328223,28.38314514939684]
    ]]}') as polygon_geom
from dual;
Then, I added two Point layers: one at 30° latitude (Point 30), and one at 32° (Point 32):
select
    mdsys.sdo_util.from_geojson('{"type":"Point","coordinates":
    [-95.42931980540513, 30.944769651994008]
    }') as point_geom
from dual;
select
    mdsys.sdo_util.from_geojson('{"type":"Point","coordinates":
    [-95.42931980540513, 32.944769651994008]
    }') as point_geom
from dual;
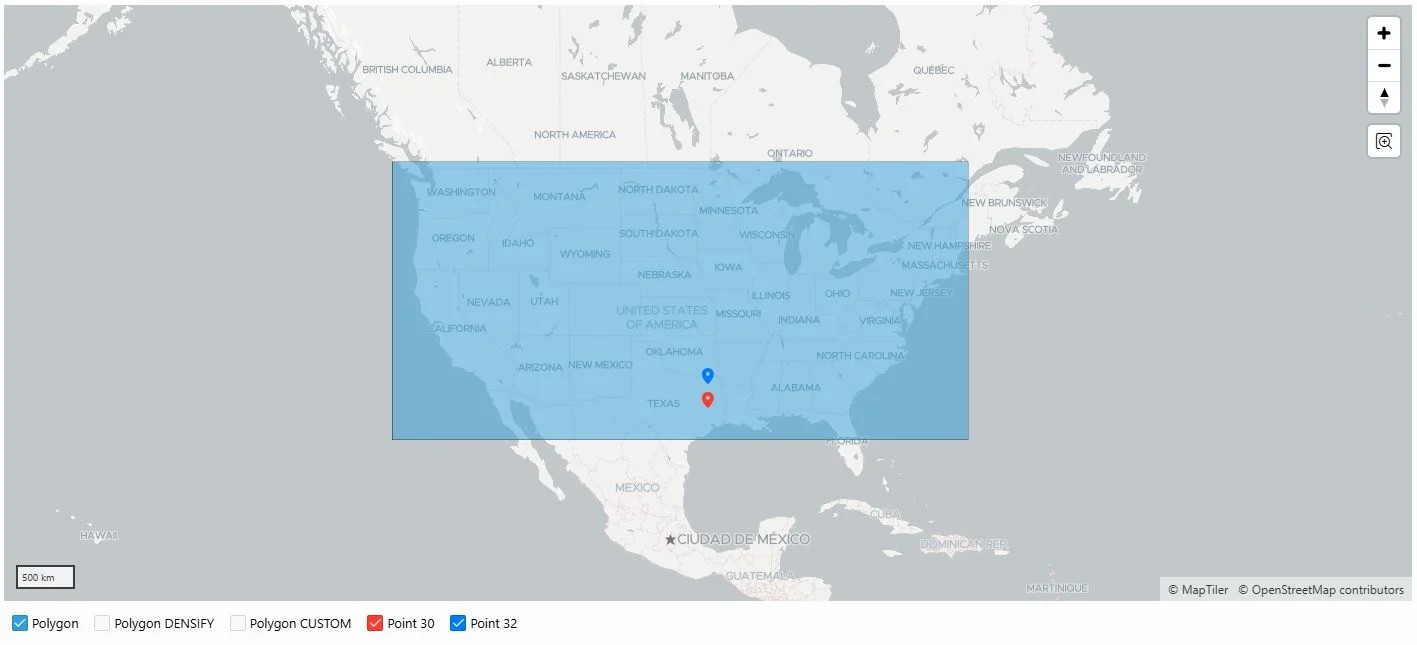
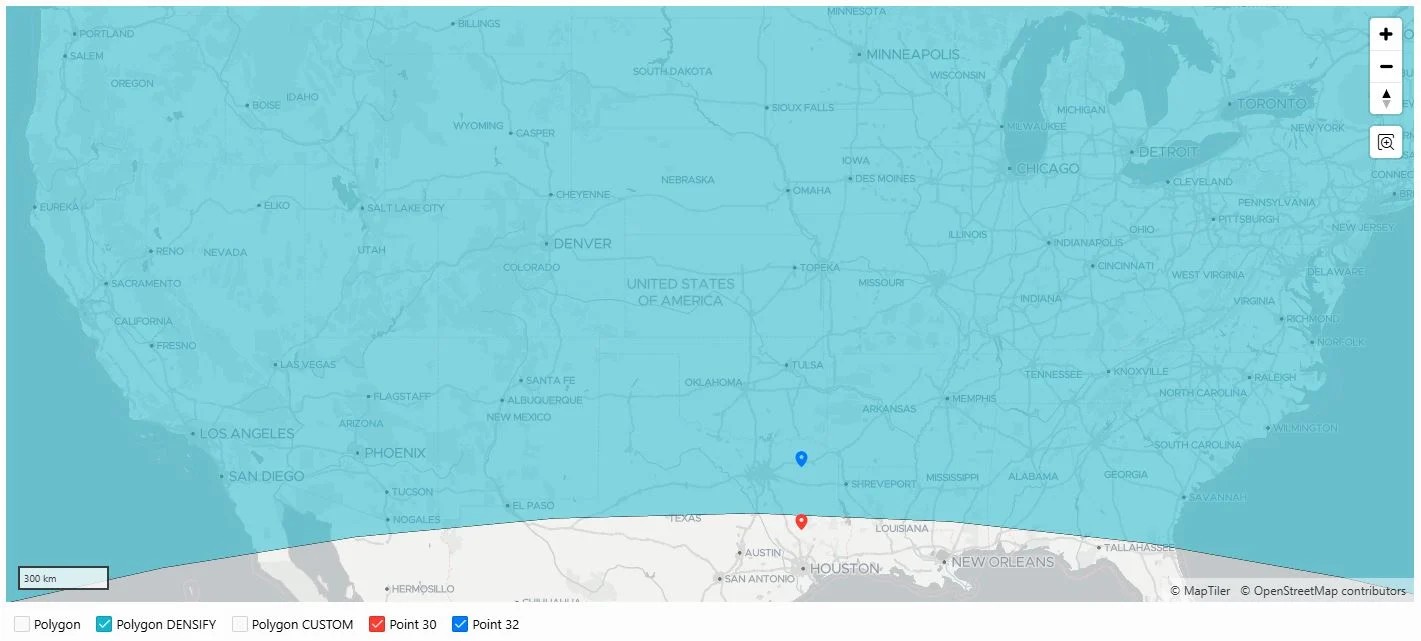
At this stage, everything looked fine. The map showed the polygon, and both points inside it. Or so I thought.
Next, I used SDO_ANYINTERACT to get the points for the report. The result was… interesting.
select
    sdo_anyinteract(
        mdsys.sdo_util.from_geojson('{"type":"Point","coordinates":
            [-95.42931980540513, 30.944769651994008]
        }'),
        mdsys.sdo_util.from_geojson('{"type":"Polygon","coordinates":[[
            [-126.51462009328223,28.38314514939684],
            [-69.800481013822,28.38314514939684],
            [-69.800481013822,49.42111619932274],
            [-126.51462009328223,49.42111619932274],
            [-126.51462009328223,28.38314514939684]
    ]]}')
    ) WK
from dual;
For Point 30, the function returns FALSE, but for Point 32, it returns TRUE. But why? On the map, both points clearly appear inside the polygon! What’s going on?
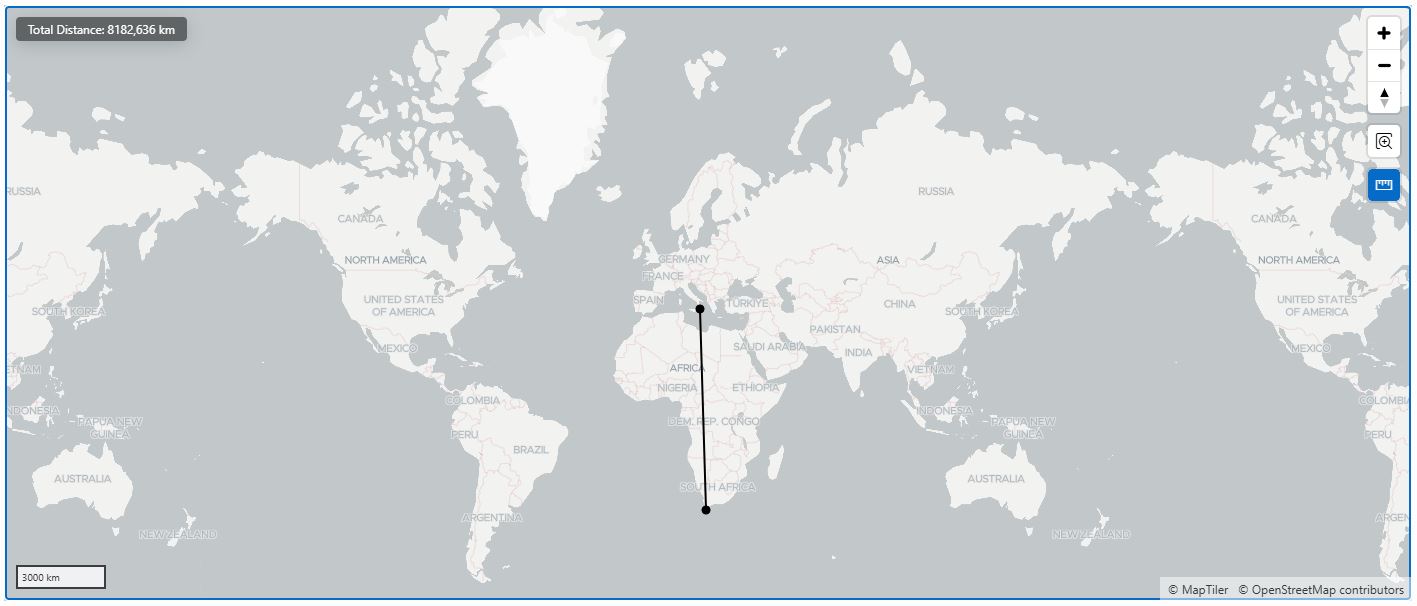
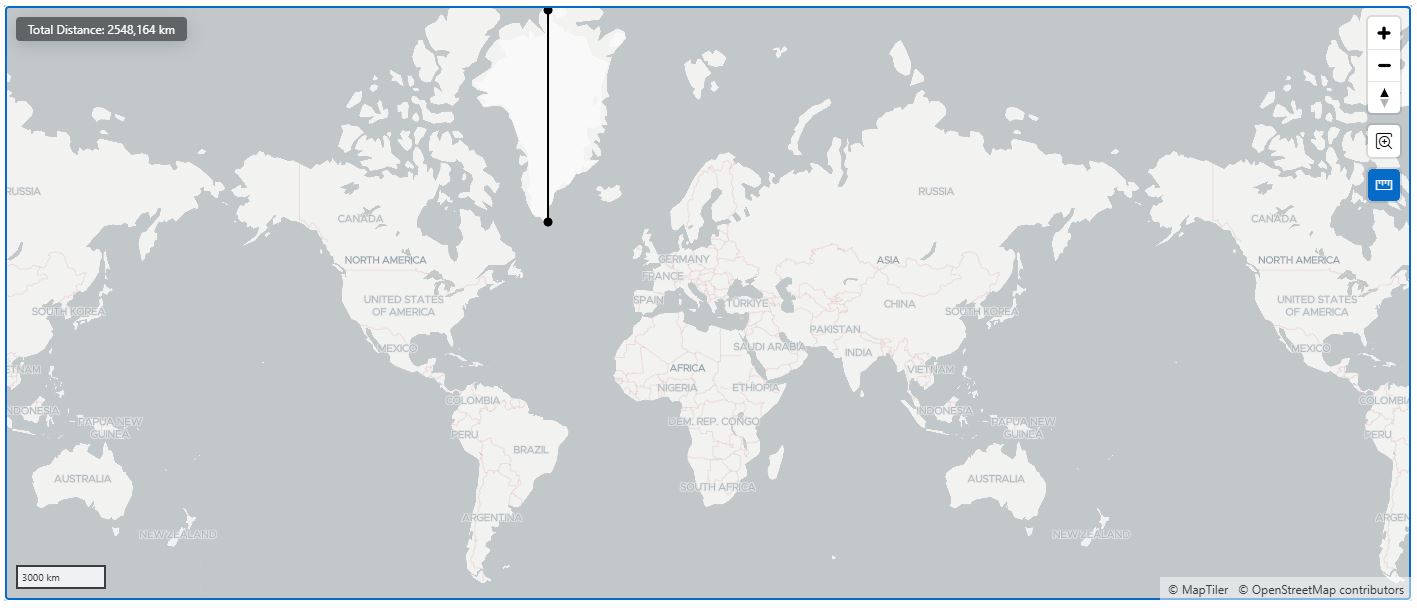
When you first look at it, it seems like the point should be inside the polygon. That’s how it looks on a regular map. But the shortest path between two points on Earth follows something called a great circle. If you look at this on a flat map, the line from (-126.5, 28.4) to (-69.8, 28.4) will appear curved upwards (north). On a globe, however, this is the straightest and shortest path. Because of this, the point (-95.4, 30.9), which seems to be inside the polygon, is actually outside of it.
💡This works the same way as intercontinental flights. When you look at a flight path from Europe to the USA on a map, it appears as a curved line, even though it’s actually the shortest route.
To make polygons match how they look on a 2D map, we can use the SDO_UTIL.DENSIFY_GEOMETRY function, which adds more points to the shape, making it closer to what we see on a flat map.
In the end… the Earth isn’t flat, it’s a sphere, and that’s why this happens! So, I created a new polygon using DENSIFY_GEOMETRY:
WITH base_polygon AS (
    SELECT SDO_GEOMETRY(
        2003, 4326, NULL,
        SDO_ELEM_INFO_ARRAY(1,1003,1),
        SDO_ORDINATE_ARRAY(
            -126.51462009328223,28.38314514939684,
            -69.800481013822,28.38314514939684,
            -69.800481013822,49.42111619932274,
            -126.51462009328223,49.42111619932274,
            -126.51462009328223,28.38314514939684
        )
    ) AS geom
    FROM dual
)
SELECT SDO_UTIL.TO_GEOJSON(
    SDO_UTIL.DENSIFY_GEOMETRY(
        geom,
        (SDO_GEOM.SDO_LENGTH(geom, 0.05) / 20) -- 20 segments
    )
) AS geojson_polygon
FROM base_polygon;
Now, the map shows the polygon correctly:
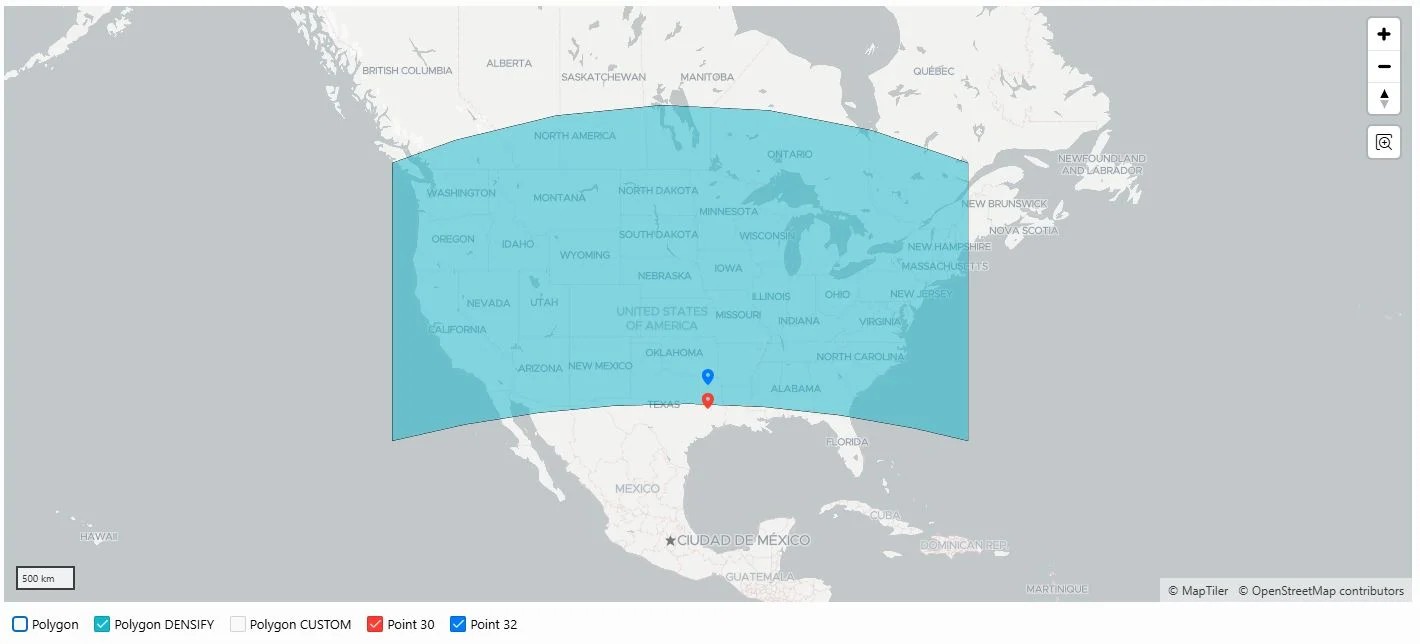
It turns out Point 30 is actually outside of the polygon. So yes, SDO_ANYINTERACT was right all along! But wait! Let’s imagine that the polygon isn’t custom, but just the visible area on the map (bounding box). Then Point 30 should be visible, and we’d expect it to be in the report. But SDO_ANYINTERACT still says FALSE, because it uses real Earth geometry. Depending on how you look at it, this can be either correct or… another problem.
If you want both points to show up, even with the bounding box polygon, you can do something simple: set SRID = NULL.
select
    sdo_anyinteract(
        mdsys.sdo_util.from_geojson('{"type":"Point","coordinates":
            [-95.42931980540513, 30.944769651994008]
        }', srid => null),
        mdsys.sdo_util.from_geojson('{"type":"Polygon","coordinates":[[
            [-126.51462009328223,28.38314514939684],
            [-69.800481013822,28.38314514939684],
            [-69.800481013822,49.42111619932274],
            [-126.51462009328223,49.42111619932274],
            [-126.51462009328223,28.38314514939684]
    ]]}', srid => null)
    ) WK
from dual;
What does this do? SDO_ANYINTERACT returns TRUE. It makes all spatial calculations happen in flat Euclidean space, not on a sphere.
So what should you do? The simplest solution is often the best. If you want the bottom of your polygon to follow a specific latitude (like 28.3°), you need to add more points along that line, not just the 4 corners. You can even use PL/SQL to generate these points automatically. That way, you’ll get a polygon that works both in a flat map and with the right spatial logic.
Map problems are more complicated than they seem. What we see on the screen doesn’t always match the actual geometry. This can cause various problems in your applications, so it’s a good idea to be aware of this issues and their root causes. APEX does help to a degree (for example, by automatically converting and showing data in default CRS), but it won’t do everything for you. Keep in mind what you want to achieve and adapt your approach accordingly.
If you’re interested in this type of content, check out some of my other articles on the Pretius blog:


