
In 2025, U.S. e-commerce accounted for approximately 16.3 % of total retail sales, leaving more than 80 % of revenue still coming from physical stores.
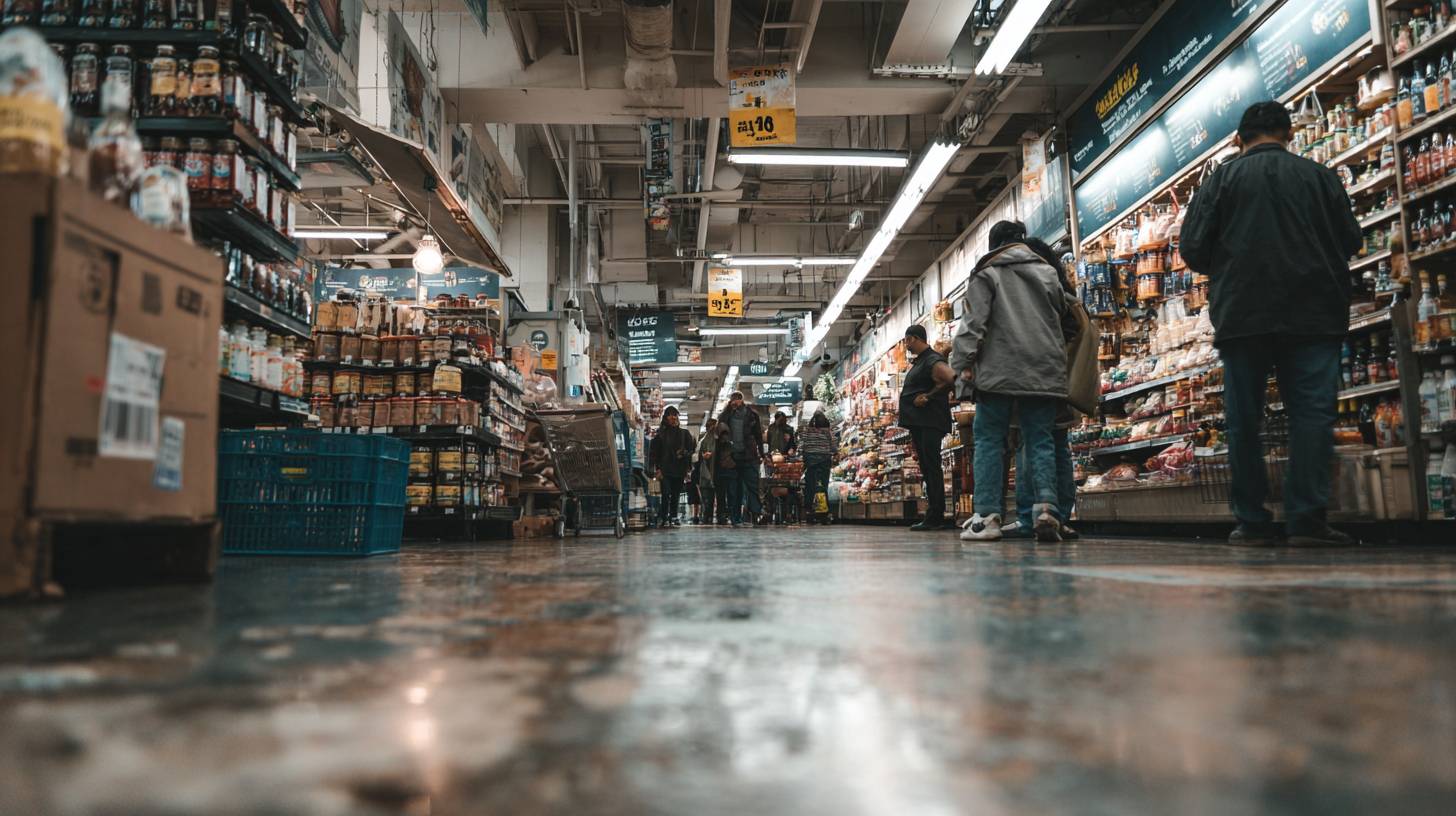
This means optimizing the in-store experience remains critical, but decisions regarding store layouts are often guided by intuition, incomplete footfall counters, and periodic assessments. What if retailers could observe exactly how shoppers move, dwell, and navigate, and then scientifically test layout changes? With computer vision analytics, you can capture granular movement data, enable flow analysis, and execute layout A/B tests with the same rigor as digital experimentation applied to physical space.
The following sections outline how computer vision enables precise shopper-flow tracking, how retailers can apply A/B testing to physical layouts, and what technical elements from architecture to calibration determine the accuracy and business impact of such systems. Read on!
Retailers often treat store layout as a static, one-time investment. Yet small changes in circulation paths, shelf placements, or promotional tabletops can meaningfully affect how many customers traverse certain zones, how long they linger, and ultimately how many products they engage with.
More optimized traffic flow allows you to reclaim underutilized space, expose high-margin products better, and alleviate congestion, which frustrates shoppers.
All of this has a tangible, positive effect on ROI. Because most sales still occur in physical stores, improving performance per square meter is a high-payoff exercise and layout changes are among the levers that directly influence that performance.
However, to optimize, you need data – and not coarse data, but fine-grained, real-time insight into individual shopper journeys.
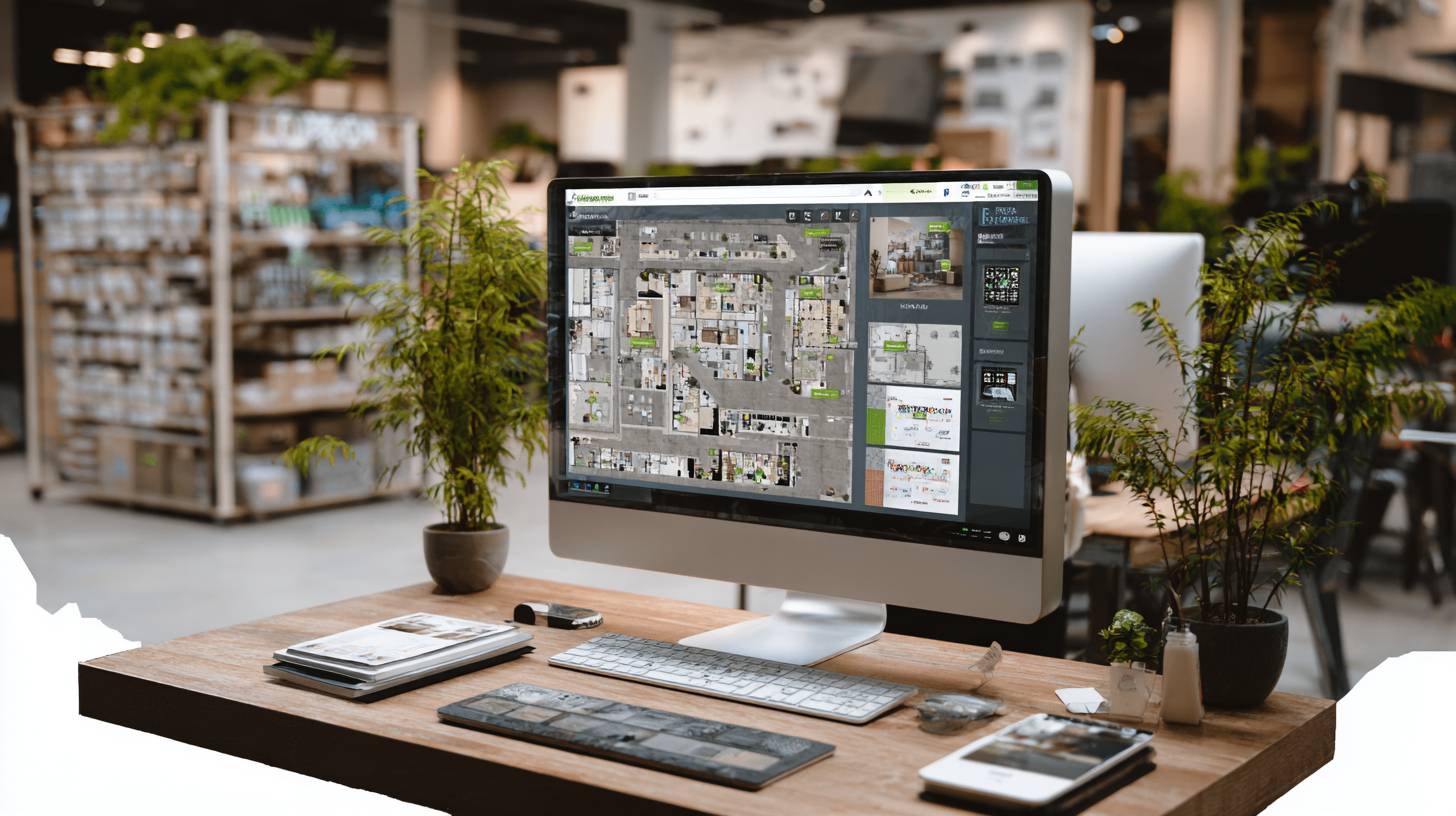
To move from coarse footfall counters to fine-grained flow models, computer vision systems integrate cameras, AI models, and analytics pipelines. The typical architecture involves:
From that pipeline emerges rich data: spatial heatmaps overlaid on store floorplans, time-series of zone occupancy, flows between zones (e.g. “entrance → main aisle → display cluster”), and dwell-time distributions per zone or display.
The ystem tracks each visitor’s path (without identity), so it allows you to answer questions such as:
For example, deploying vision analytics in pilot stores often reveals that certain corners or corridors receive < 5% of traffic compared to adjacent aisles, highlighting wasted walking space.
Because data is captured continuously, you can monitor trends and detect anomalies. If a promotional display stops generating expected interest, a drop in dwell-time at that zone is flagged immediately, so staff can re-evaluate signage, product presentation, or check visibility.
Raw trajectories are useful, but the real value lies in translating them into actionable operational and design decisions. Some core analyses include:
A visualization where the floorplan is colored by visit frequency or dwell intensity, allowing planners to visually see hotspots, bottlenecks, and underutilized zones.
Define logical “zones” (entrance, category A, promotional endcaps, checkout corridors). For each zone, measure:
| Metric | Purpose / Insight |
| Zone entries per time unit | How many unique visitors enter that zone (volume) |
| Average dwell time in zone | Engagement indicator: longer dwell suggests interest |
| Exit-to-entry ratio | Proportion of visitors who leave a zone without visiting downstream zones |
| Transition counts (zone i → zone j) | Flow weights—how many visitors go from i to j |
| Normalized traffic (density per m²) | Helps detect overcrowding or underuse |
By comparing these metrics across zones, a retailer can detect mismatches: high entry but low dwell suggests weak product placement or visual design; high dwell but low downstream transition suggests a physical barrier or poor signage; very low entries suggest location neglect or bad routing.
You can segment by time periods (morning vs afternoon, weekday vs weekend) or visitor cohorts (though computer vision is anonymous, behavior segments can emerge). This allows testing whether a layout performs differently under different load conditions.
If metrics drop sharply (e.g. dwell in a promotional zone falls below threshold), the system can alert store managers to intervene. For instance, relocating a display, adjusting lighting, or re-merchandising.
These analytics then feed into decision loops: you hypothesize a layout tweak, monitor its impact via these metrics, and refine.
One of the most powerful ways to validate layout changes is through experimentation. A/B testing in a physical environment must account for variability (traffic fluctuations, day-of-week effects, promotions), but with computer vision analytics, it becomes feasible.
Parallel (across stores):
Implement Layout A in one store (or group), Layout B in another similar store. Use CV analytics to compare metrics like dwell times, zone transitions, and traffic distribution. If Layout B shows a consistent lift in target KPIs, roll it out more broadly.
Sequential (within same store):
Run Layout A for a defined period, then switch to Layout B. Compare matched days (e.g. same weekdays, similar seasonal context). CV provides robust controls, since the same traffic detection pipeline is used in both periods, mitigating measurement bias.
Simulated A/B (digital twin):
Before physically moving shelves, use AI-based simulation models (trained on actual trajectory data) to test layout variants in silico. This narrows the field of viable options. Those layouts predicted to improve flows can then be trialed in the real store.
Suppose you are testing whether placing a promoted product cluster nearer the entrance (Layout B) vs deeper in the store (Layout A) improves engagement. You’d measure:
The layout that consistently shows higher dwell + transition + conversion (normalized by footfall) is the winner. Because the pipeline is identical, bias from measurement differences is minimized.
Here is a simplified but realistic case illustrating the method:
A regional apparel retailer selected two comparable stores (Store A, Store B). They installed vision analytics and collected baseline data over three weeks under existing layouts. Key findings:
They conceived two layout variants:
They ran Layout B in Store B, kept Layout A in Store A, for four weeks, collecting metrics. Results:
Because the same vision pipeline measured both stores, attribution of improvement to layout changes is credible. Based on the test, the retailer updated all stores to adopt elements from Layout B.
This case underscores how computer vision enables scientific validation of layout ideas rather than relying on guesswork.

When deploying such systems, several practical aspects merit attention.
Optimal coverage requires overhead or wide-angle lenses to minimize occlusions (e.g. ceiling-mounted fisheye lenses). It’s essential to calibrate lens distortion and map image coordinates to real-world floorplan coordinates.
Performing inference at the edge (on-device or local server) reduces network load and latency. Raw video frames need not be transferred to central servers—only anonymized metadata (trajectories, zone counts). This architecture also aids privacy compliance.
Initial calibration must map camera views into store coordinates, align overlapping fields of view, and validate that detections correlate with manual ground truth. Periodic audits help ensure tracker drift or occlusion errors are caught.
To fully measure conversion (footfall → purchase), CV data should be integrated (or at least correlated) with POS or inventory systems. A design where footfall in a zone in a time window is matched with sales from that zone simplifies attribution.
Begin with one or two pilot stores, focus on a single use case (e.g. test layout variant). Use that to validate system stability, staff adoption, and insights usability. Then expand gradually. Early success builds support.
Because vision systems capture movement patterns, privacy must be baked in: face blurring or no face storage; in-memory processing; anonymization by design. Retailers should publish their use and reassure customers.
Beyond tech, success requires collaboration between store ops, merchandisers, data scientists, and IT. Analysts should translate CV metric insights into merch layout rules, and store teams must operationalize those rules.
A balanced view requires acknowledging limitations:
Mitigation strategies include frequent calibration, buffering test periods across cycles, combining CV insights with human merchant intuition, and starting small with pilots.
Once a CV system is established, layout optimization becomes an iterative process – not a one-off project. Stores evolve, assortments change, shopper behavior shifts. A feedback loop of measure → test → refine enables continuous improvement.
Enhancements to this loop may include:
Such capabilities accelerate learning and reduce risk. Over time, a store can truly function as a living experiment whose design is continuously refined to match real customer behavior.
In-store layout optimization is no longer a matter of guesswork or occasional refreshes – it should become an iterative, data-driven process supported by technology. With computer vision analytics, retailers gain visibility into true shopper behavior: how people move, pause, deviate, and explore. Applying A/B testing methods to physical stores, grounded in the same metric pipeline, allows rigorous comparison of layout variants.
When implemented thoughtfully – with correct camera placement, calibration, privacy safeguards, and integration into operations and POS – the ROI can be compelling: improved zone engagement, more balanced traffic, better exposure of high-margin items, and stronger conversion rates. The technical complexity is real, but manageable. The future belongs to retailers that treat their brick-and-mortar stores as continuous experimentation grounds, refining the environment in lockstep with customer behavior shifts.
If your organization is exploring computer vision or advanced analytics, this approach offers a clear roadmap for turning movement data into business value. Write us at hello@pretius.com or use the contact form below if you want to implement this technology in your shops.
It provides detailed, objective data about shopper movement and dwell time. By visualizing these patterns, retailers can detect bottlenecks, identify underused zones, and evaluate how layout changes affect engagement and sales.
Two layout versions are tested under similar conditions, either across different stores or sequentially in the same location. Computer vision tracks customer flow and dwell time to determine which configuration performs better based on measurable behavior data.
Computer vision analytics reveals high-traffic zones, path preferences, and dwell-time hotspots. When linked with POS data, it can highlight which areas or product displays convert traffic into actual sales.
Usually a set of overhead or wide-angle cameras, local (edge) processing for video frames, and a visualization dashboard for analysis. Proper camera placement and calibration are key to data accuracy.
Modern systems process video locally and store only anonymized metadata. Faces and personal identifiers are not recorded, ensuring compliance with GDPR and other privacy standards.


